Best JavaScript Technology: AnyChart JS Charts Library Wins 2018 DEVIES Award!
February 6th, 2018 by AnyChart Team It’s happened! Our AnyChart JS Charts library has just been officially named the best in JavaScript Technology for innovation and received a prestigious DEVIES award in California! (See all the 2018 DEVIES winners — one for each of the 15 categories.)
2018 DEVIES is reported to be the world’s leading DevTech Awards event, taking place these days during DeveloperWeek in Oakland, CA, the largest developer expo and conference series globally.
- Categories: AnyChart Charting Component, AnyGantt, AnyMap, AnyStock, HTML5, JavaScript, News, Qlik, Success Stories
- 6 Comments »
Data Visualization in 2017: Highlights – DataViz Weekly
December 30th, 2017 by AnyChart Team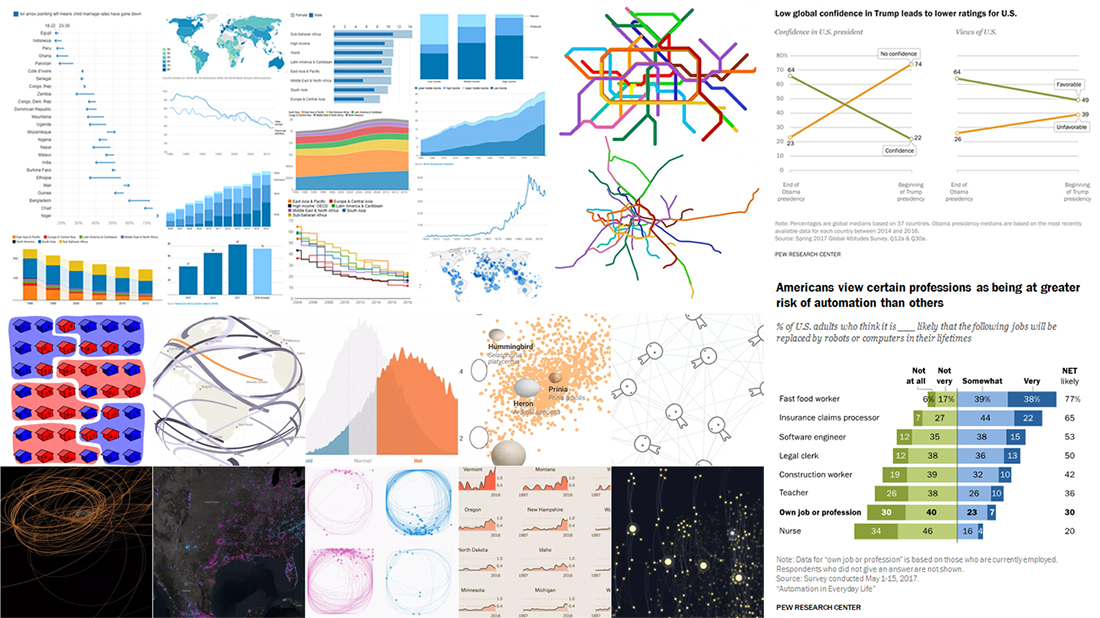
The new 2018 year is coming very soon, and now is a great time to look back and remember the highlights from data visualization in 2017.
A few words about our solutions to start with. After the very productive year of 2016, we at AnyChart JS Charts did a lot in 2017, too. 4 major releases full of new features! After versions 7.13.0 and 7.14.0, we launched the brand new, 8th generation of our JavaScript charting libraries, featuring a modular system and custom JS builder (8.0.0). In December 2017, we released AnyChart 8.1.0. In addition, we published a number of plugins (for Qlik, Android, Angular, Ionic and more) and technical integration samples for popular technology stacks, released Chartopedia and the brand new Playground with a whole bunch of chart examples added to our documentation, API reference and galleries. And even more.
A lot of great charts and infographics were created in 2017 by various people and companies from around the world. In the present, this year’s last Data Visualization Weekly post, we’ll tell you about 4 year-in-review articles featuring the most interesting visualizations of 2017:
- 10 Best Projects in Data Visualization in 2017 — FlowingData.
- Quartz: Top 5 Charts in 2017, According to Reddit — Quartz.
- Year of 2017 in 12 Charts — The World Bank.
- 17 Striking Findings in 2017 — Pew Research.
Happy New Year in JavaScript Charting: AnyChart 8.1.0 Is Out!
December 20th, 2017 by AnyChart Team The New Year and Christmas are already just around the corner, and we have something astonishing for you in this magical time! The next major update for our product family of JavaScript charting libraries is now released, so meet AnyChart 8.1.0!
Check out what new cool and useful features are delivered in the new versions of our HTML5-based interactive data visualization solutions AnyChart, AnyStock, AnyGantt and AnyMap, as well as what we are going to work on next.
- Categories: AnyChart Charting Component, AnyGantt, AnyMap, AnyStock, Financial Charts, Gantt Chart, HTML5, JavaScript, News, Qlik, Stock Charts
- 2 Comments »
Conditional Custom Drawing in JavaScript Charts — Challenge AnyChart!
December 13th, 2017 by Vitaly Radionov The time has come for a new Challenge AnyChart! article! We continue to receive interesting data visualization tasks from our wonderful customers and are happy to share with our blog readers how to solve some of the most inspiring ones with the help of our JavaScript charting libraries.
In today’s tutorial, let’s dig into custom drawing and create an interactive HTML5 line chart of which the segments with negative values are painted with a different color than the rest of the graph.
- Categories: AnyChart Charting Component, Challenge AnyChart!, Charts and Art, HTML5, JavaScript, Tips and Tricks
- No Comments »
How to Create Pie Chart with JavaScript
December 6th, 2017 by Timothy Loginov Have you ever wondered, how web developers create and integrate interactive JavaScript pie charts into HTML5 apps and web pages? If the answer is yes – keep on reading! This article explains how to create, change and integrate a pie chart into your web page. Beware! A hot-button political issue is present in this article. But we will not offend anyone!
Pie chart is one of the most popular chart types. Mathematically speaking it looks like a circle divided into sectors which represent a part of a whole. For the most of us, pie charts look like real pies or pizzas cut into several slices. In this article, you will find a detailed tutorial on how to build one, with JS chart code samples.
Read the JS charting tutorial »
- Categories: AnyChart Charting Component, HTML5, JavaScript, JavaScript Chart Tutorials, Tips and Tricks
- 29 Comments »
How to Add Multi-level Category Axis — Challenge AnyChart!
November 29th, 2017 by Vitaly Radionov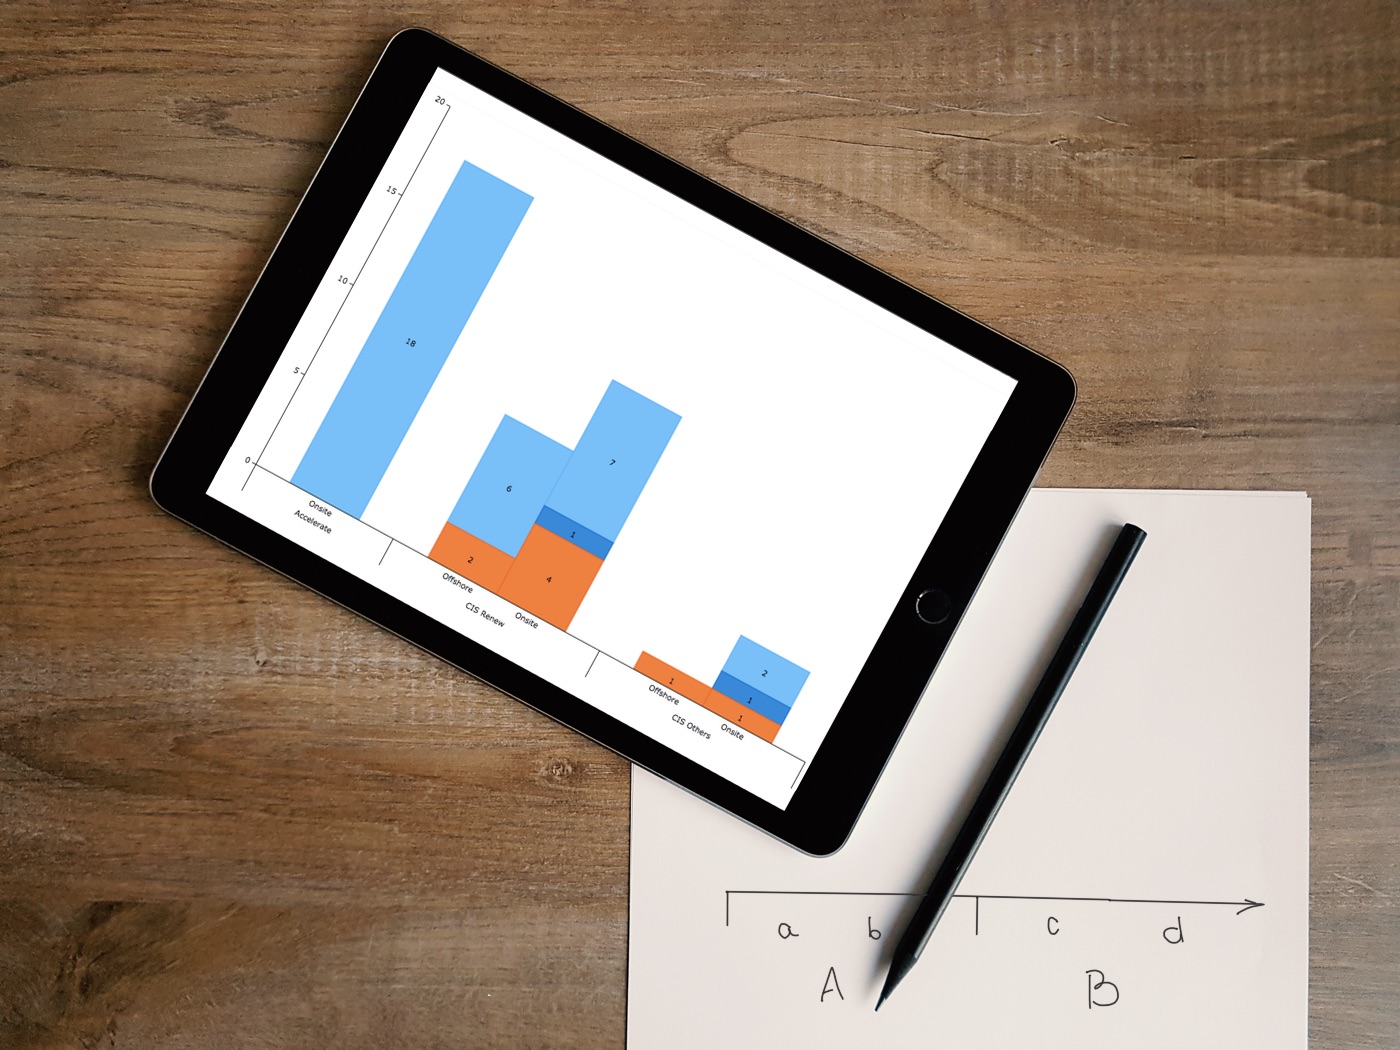 We are glad to present to you a new article in the Challenge AnyChart! series.
Just to remind you, these are articles inspired by your requests to our Support Team and our will to publicly prove that the opportunities of interactive data visualization with our JavaScript (HTML5) charting libraries are profound.
One of our customers asked us how to add a multi-level category axis for categorical data and display subcategories. Ok, there you go! We’ve made a quick tutorial and created the corresponding JavaScript chart example (you can already see it in the title picture).
- Categories: AnyChart Charting Component, Challenge AnyChart!, Charts and Art, HTML5, JavaScript, Tips and Tricks
- 1 Comment »
How to Create JavaScript Area Chart
October 28th, 2017 by Timothy Loginov Want to know how to build a JavaScript area chart? This article will show you how to do that and tell you who invented area charts in the late 18th century.
The area chart is one of the basic charts used to show changes in data over time. The key feature of this chart type is a colored area between the horizontal X-axis and the line marking the changing value. It can be filled with a color, gradient color, or with a hatch fill.
Look at the chart on the title image. That’s the data visualization being created along the tutorial. Such a JavaScript-based area chart will be interactive and good-looking in any browser, on any website and in any app in HTML5. All samples used in the article are available in our collection on CodePen.
Read the JS charting tutorial »
- Categories: AnyChart Charting Component, HTML5, JavaScript, JavaScript Chart Tutorials, Tips and Tricks
- 3 Comments »
Advanced Visualization of Spot in JS Polar Charts — Challenge AnyChart!
October 27th, 2017 by Vitaly Radionov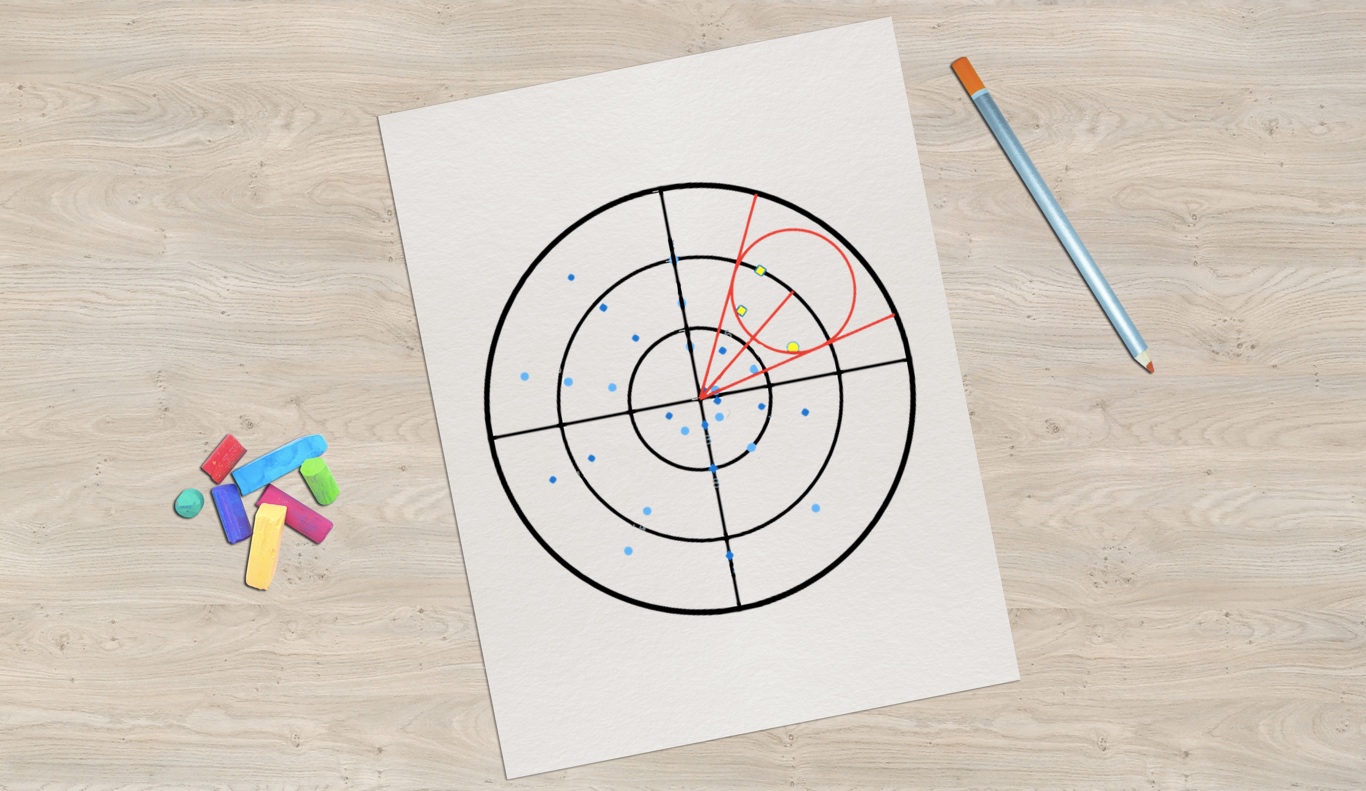 Meet Challenge AnyChart, a brand new feature on our blog that every dataviz engineer will fall in love with! Each article in this series will be a quick tutorial on how to complete a specific data visualization task that – at first sight – seems too complicated or even unsolvable with AnyChart JS Charts.
From now on, once in a couple of weeks, we’ll pick a thrilling challenge – one of those you’ve shared with our Support Team. And then we’ll show you the best way to deal with it. So all of you can see: Nothing is impossible in AnyChart!
The first challenge for the very first Challenge AnyChart issue is about making an advanced interactive visualization of the spot in a JavaScript polar chart.
- Categories: AnyChart Charting Component, Challenge AnyChart!, Charts and Art, HTML5, JavaScript, Tips and Tricks
- No Comments »
Creating JavaScript Bar Chart
October 25th, 2017 by Timothy Loginov How to create a JavaScript bar chart and why is this important? Every day, data visualization becomes all the more powerful and important area of the Web. The volume of information grows, and it must be made understandable as fast as possible. That’s when data visualization instruments like charts and dashboards become a great help.
Creating HTML5 charts might seem a complicated task, but this assumption is wrong. This article blows this prejudice to pieces and shows how to build an interactive bar chart using JavaScript.
The result will look like on the picture above. Then you’ll also learn how to quickly modify and customize such a JavaScript (HTML5) bar chart. All the JS chart examples used along the tutorial can be found on CodePen.
Read the JS charting tutorial »
- Categories: AnyChart Charting Component, HTML5, JavaScript, JavaScript Chart Tutorials, Tips and Tricks
- 15 Comments »
Modular JavaScript Charting: AnyChart 8 Premiere
October 2nd, 2017 by AnyChart Team Fall is an amazing time for TV, movie, theater, and other art lovers as that’s when a lot of premieres are being launched. Well, we are happy to contribute to the debut mainstream this time! Meet AnyChart 8, a modular JavaScript charting system taking the convenience, performance, and customization in the art of interactive data visualization to the next level.
Join us in reviewing the core innovations delivered in the 8th, module-based generation of AnyChart, including the brand new features now available in our JS charting libraries AnyChart, AnyStock, AnyGantt, and AnyMap, as well as what else is in our nearest plans.
AnyChart JS Charts 8.0.0: Modules, Custom Builds, and Much More
The 8.0.0 release of the AnyChart, AnyGantt, AnyMap, and AnyStock JavaScript (HTML5) charting libraries delivers a lot of brand new features and technical improvements. Please see the list below for a quick overview of what’s new.
- Categories: AnyChart Charting Component, AnyGantt, AnyMap, AnyStock, Dashboards, Financial Charts, Gantt Chart, HTML5, JavaScript, News, Stock Charts
- 5 Comments »