Enhancing AI-Assisted JavaScript Chart Development with Context7 MCP and Claude
November 26th, 2025 by AnyChart Team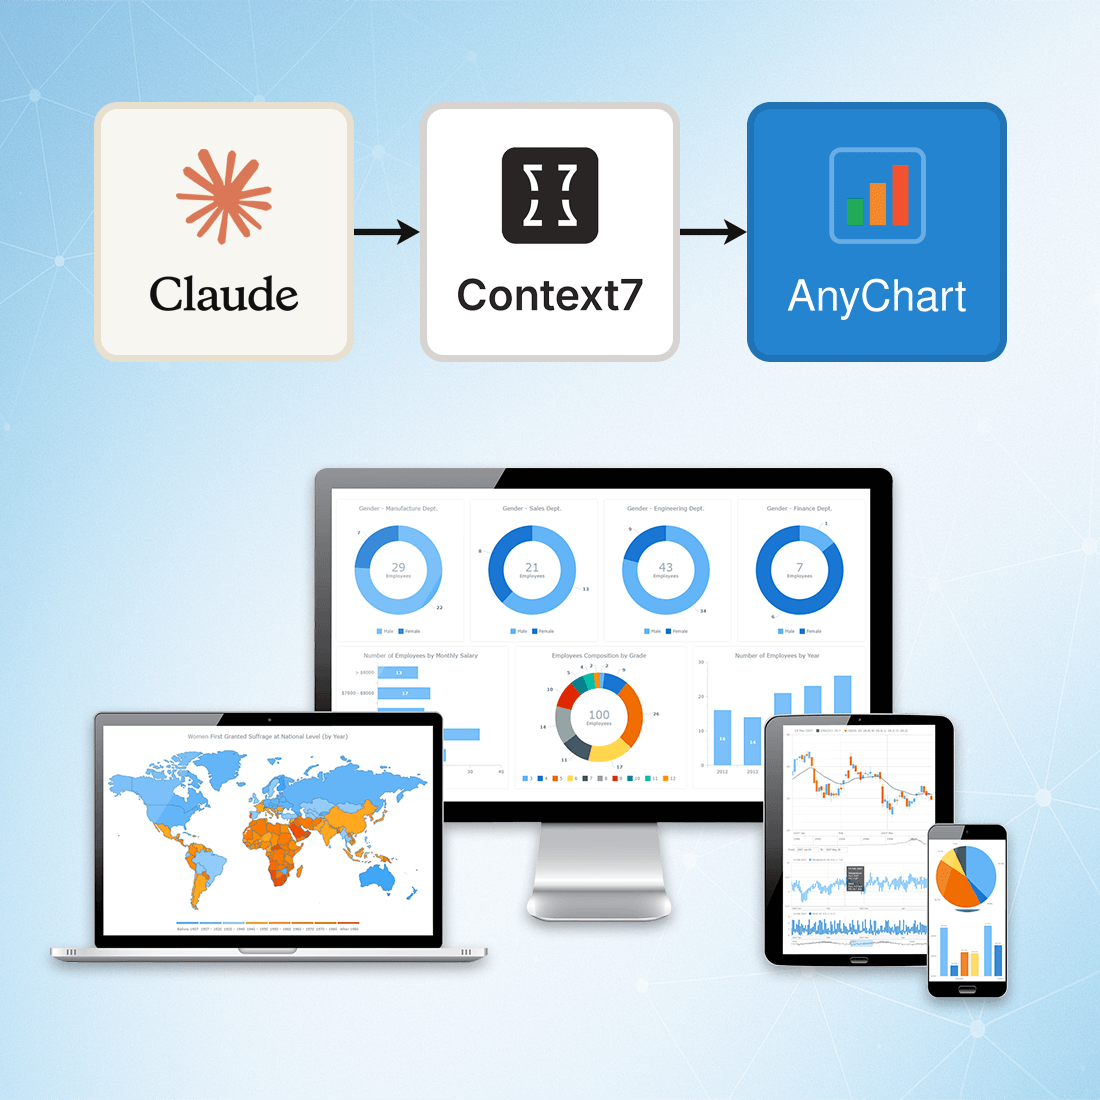 At AnyChart, we are constantly exploring tools and workflows that help developers work more efficiently, stay up to date, and minimize friction when integrating data visualization into their projects.
One approach we’ve recently tested — and found highly effective — is connecting Claude to Context7 via the Model Context Protocol (MCP). This integration gives Claude access to a continuously updated, extensive database of technical documentation across libraries, packages, and APIs.
This means you can rely on Claude not just for reasoning, but also for live, accurate, and authoritative documentation retrieval, dramatically reducing the chances of outdated suggestions or hallucinated methods.
- Categories: AnyChart Charting Component, AnyGantt, AnyMap, AnyStock, Big Data, Business Intelligence, Charts and Art, Dashboards, Financial Charts, Gantt Chart, GraphicsJS, HTML5, JavaScript, JS Chart Tips, News, Stock Charts, Third-Party Developers, Tips and Tricks
- No Comments »
Best JavaScript Gantt Chart Libraries in 2025–2026
November 5th, 2025 by Jay Stevenson Gantt charts are among the most effective ways to visualize tasks, timelines, and dependencies, making them a core component of modern project management practices. For developers building web applications, the right JavaScript Gantt chart library can dramatically save development time and deliver a professional, interactive experience directly in the browser.
The ecosystem in 2025–2026 includes a wide range of solutions — from free open-source libraries for simple timelines to enterprise-grade components with advanced scheduling engines and resource management features. Some prioritize speed and simplicity, while others focus on deep functionality and seamless integration into broader charting or UI stacks.
This article reviews the most notable JavaScript Gantt chart libraries available today. Each library is presented with its functionality, performance and scalability, integration options, licensing, and support. Whether you are building an internal tool, a SaaS application, or a full-scale enterprise system, this guide will help you quickly identify the Gantt solution that best fits your needs.
- Categories: AnyChart Charting Component, AnyGantt, Big Data, Business Intelligence, Dashboards, Gantt Chart, HTML5, JavaScript, Tips and Tricks
- No Comments »
Gantt Chart Legend — JS Chart Tips
November 21st, 2024 by AnyChart Team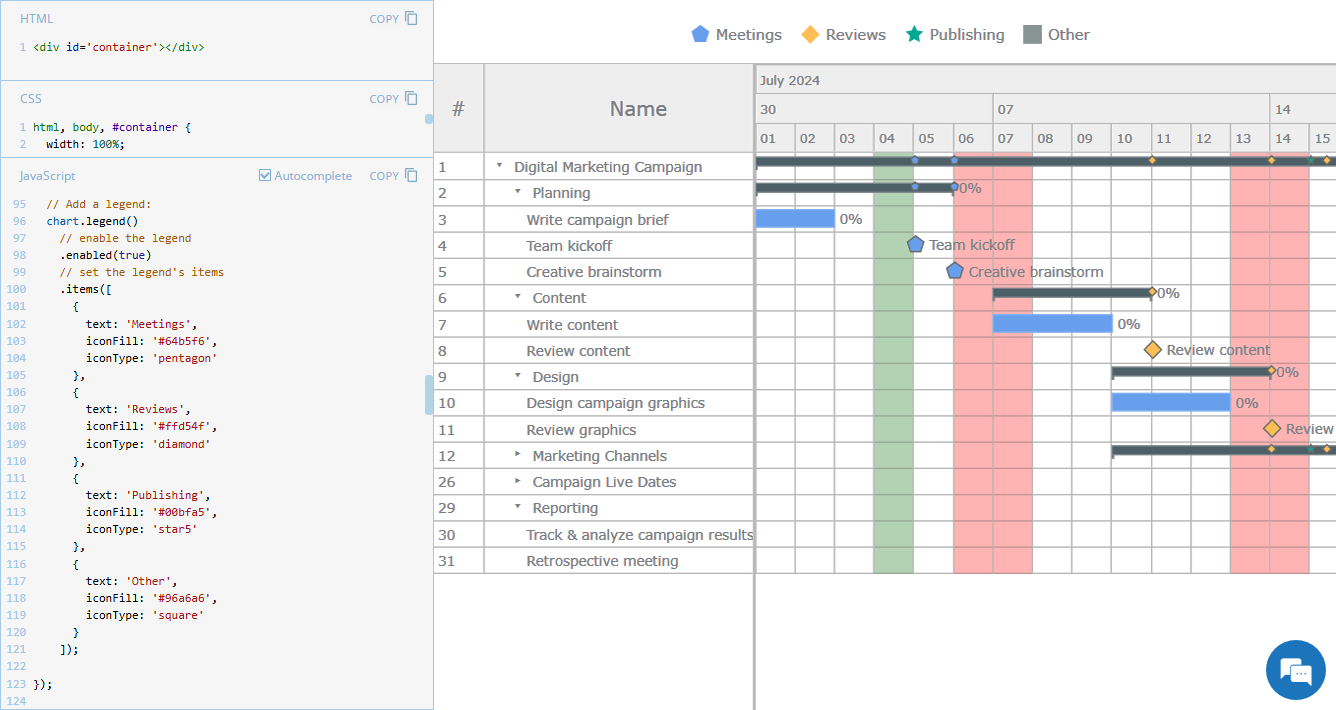 Legend is a vital element in many charts, helping viewers quickly understand what each visual component represents. However, it is not always a must-have for every chart type. For instance, Gantt charts often work perfectly fine without a legend, so it is not enabled in our JavaScript Gantt Chart by default. That said, creating one is straightforward. Right now, we will show you how to add a legend to a Gantt chart — join us as we continue our JS Chart Tips series, sharing quick solutions inspired by real customer queries!
- Categories: AnyChart Charting Component, AnyGantt, Business Intelligence, Gantt Chart, HTML5, JavaScript, JS Chart Tips, Tips and Tricks
- 2 Comments »
Introducing AnyChart 8.13.0 for Elevated JavaScript Charting Experience
October 3rd, 2024 by AnyChart Team AnyChart 8.13.0 is now available, bringing a set of new features and improvements designed to further elevate your data visualization experience. In this release, we’ve focused on enhancing the Timeline, Waterfall, and Circle Packing charts in our JavaScript charting library, making them even more flexible and user-friendly. Read on to explore what’s new!
- Categories: AnyChart Charting Component, AnyGantt, AnyMap, AnyStock, Big Data, Business Intelligence, Dashboards, Financial Charts, Gantt Chart, HTML5, JavaScript, News, Stock Charts
- No Comments »
Unwrapping Enhanced Interactivity for Calendar and Circle Packing Charts in AnyChart 8.12.0
December 7th, 2023 by AnyChart Team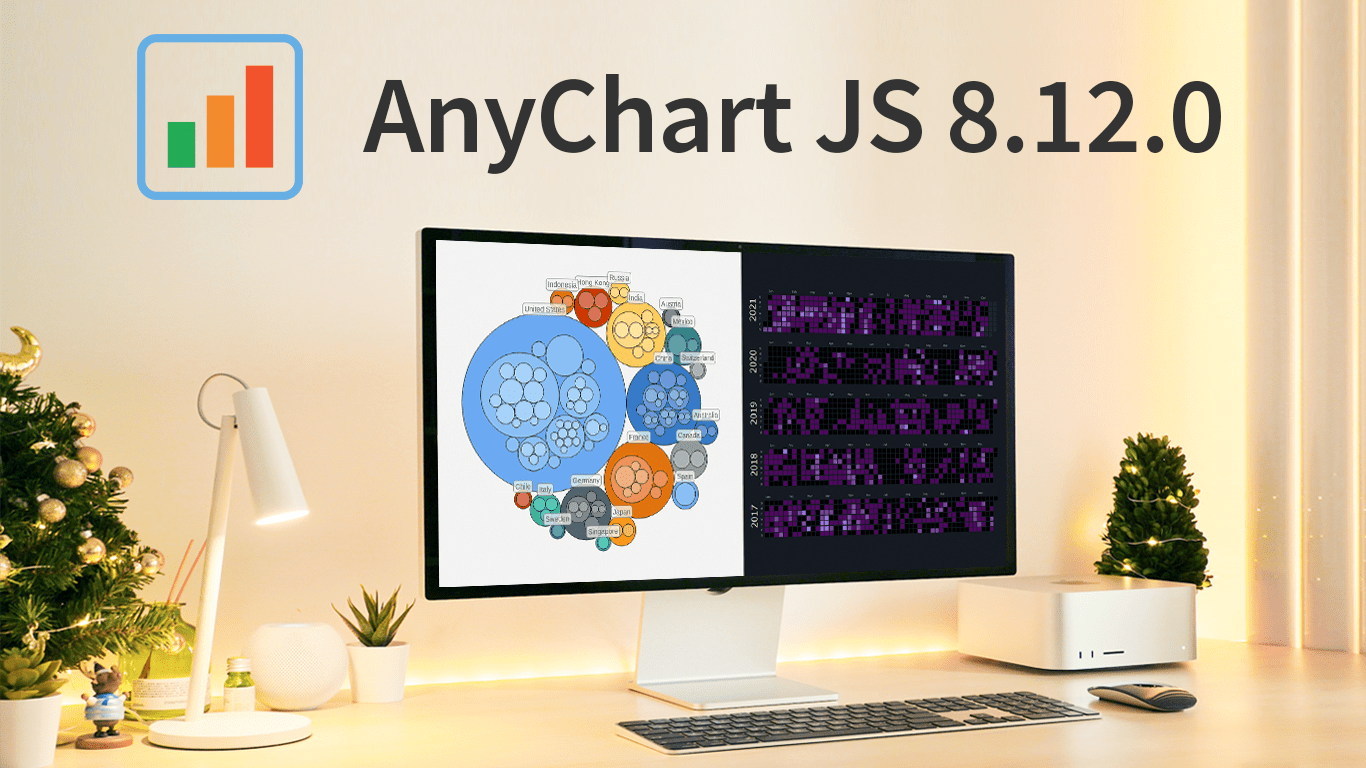 As the magic holiday season approaches, we’re thrilled to unwrap our latest gift of the year — AnyChart 8.12.0, the newest version of our powerful JavaScript charting library. Packed with various bug fixes and improvements, this release introduces a remarkable feature for Calendar and Circle Packing charts — interactivity events. Learn more about it and upgrade right now!
- Categories: AnyChart Charting Component, AnyGantt, AnyMap, AnyStock, Big Data, Business Intelligence, Dashboards, Financial Charts, Gantt Chart, HTML5, JavaScript, News, Stock Charts
- No Comments »
How to Create Resource Chart with JavaScript
October 16th, 2023 by Awan Shrestha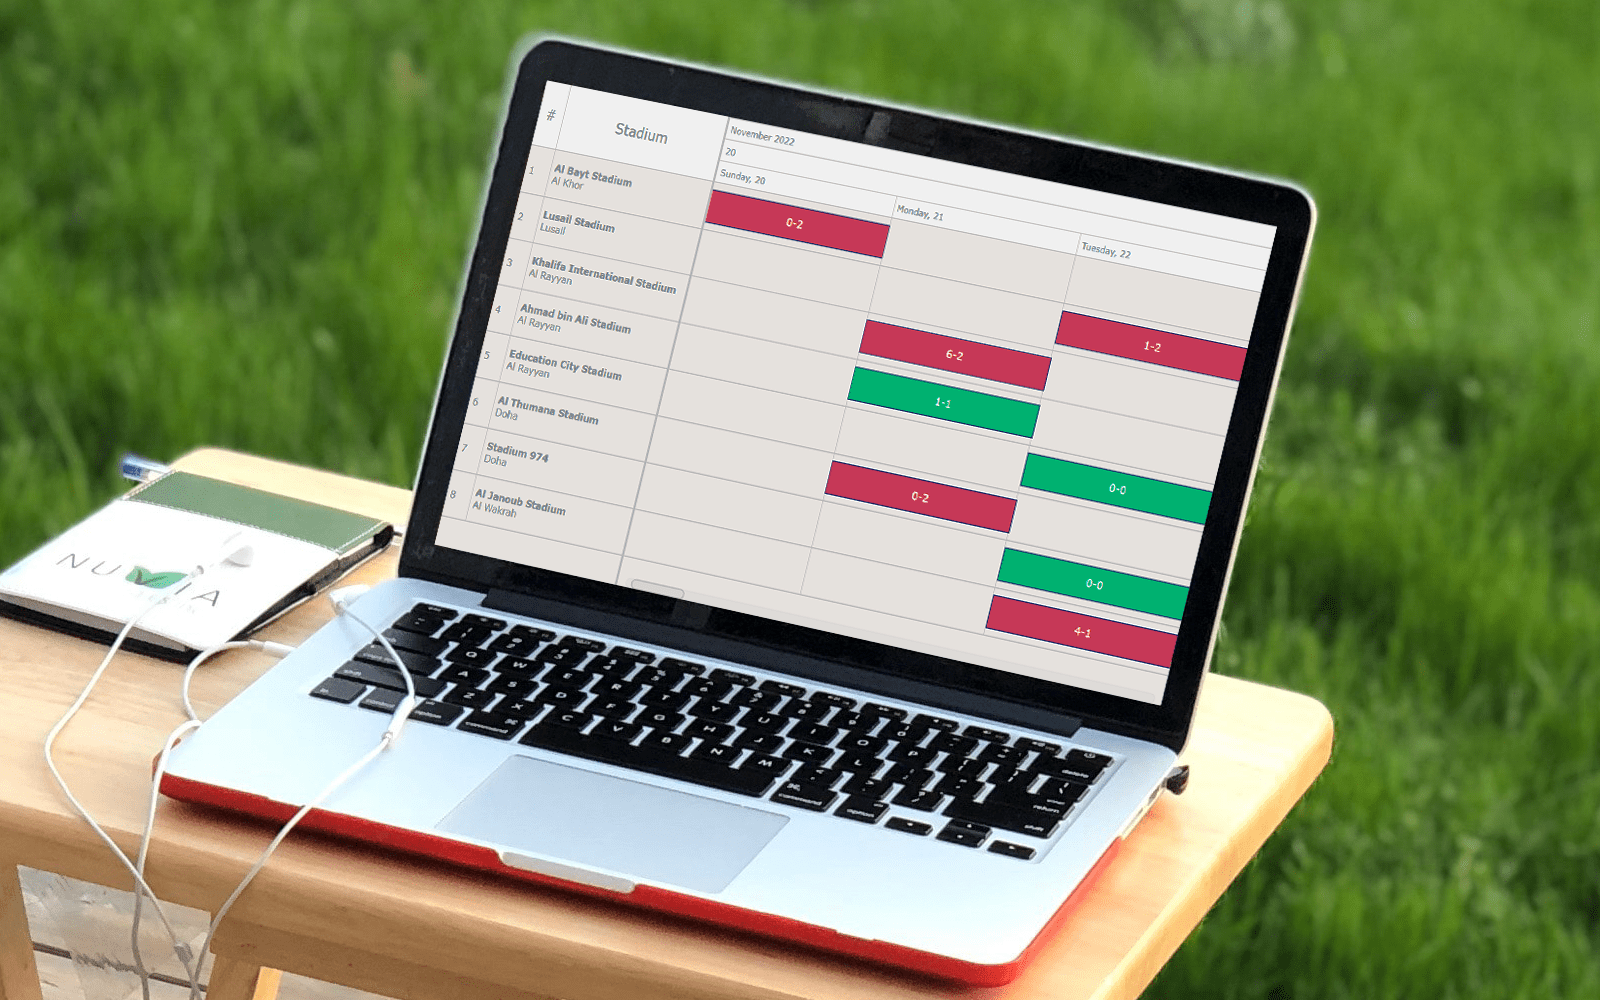 In today’s data-driven world, data visualization simplifies complex information and empowers individuals to make informed decisions. One particularly valuable chart type is the Resource Chart, which facilitates efficient resource allocation. This tutorial will be your essential guide to creating dynamic resource charts using JavaScript.
A resource chart is a type of Gantt chart that visualizes data about resource utilization, such as equipment, employees, and so on. It provides a comprehensive overview, making it easier to make informed decisions promptly. As an illustrative example, in this tutorial, I will represent the FIFA World Cup 2022 Qatar schedule by stadium, enabling you to track when and where each game took place.
Get your coding boots ready, and by the end of this guide, you’ll be well-equipped to create your own JS-based resource chart and have a valuable tool at your disposal for tracking your next favorite tournament, or servers status, or employee project assignments, or anything else of that kind.
Read the JS charting tutorial »
- Categories: AnyChart Charting Component, AnyGantt, Business Intelligence, Gantt Chart, HTML5, JavaScript, JavaScript Chart Tutorials, Tips and Tricks
- No Comments »
AnyChart Named Best in Data Analytics & Visualization 🏆
February 3rd, 2023 by AnyChart Team We’re proud to announce that AnyChart has won a prestigious 2023 DEVIES Award in the Data Analytics & Visualization category! Many thanks to the jury and congratulations to all our partners and customers!
Celebrating 20 years in the market this year, we at AnyChart have been working hard to develop the best-in-class data visualization solutions. And we will keep innovating and excelling!
The DEVIES Awards are the definitive annual awards for the software industry, recognizing outstanding design, engineering, and innovation in developer technology across multiple categories. This year’s winners were selected from record-high hundreds of nominations by an expert-led panel of the DevNetwork Advisory Board, including representatives of Accenture, DigitalOcean, EA, Google, IBM, Salesforce, and other great companies.
- Categories: AnyChart Charting Component, AnyGantt, AnyMap, AnyStock, Big Data, Business Intelligence, Dashboards, Financial Charts, Gantt Chart, GraphicsJS, HTML5, JavaScript, News, Oracle Apex, Qlik, Stock Charts, Success Stories
- 2 Comments »
AnyChart JS Charts 8.11.0 Released with Awesome New Data Visualization Features
December 7th, 2021 by AnyChart Team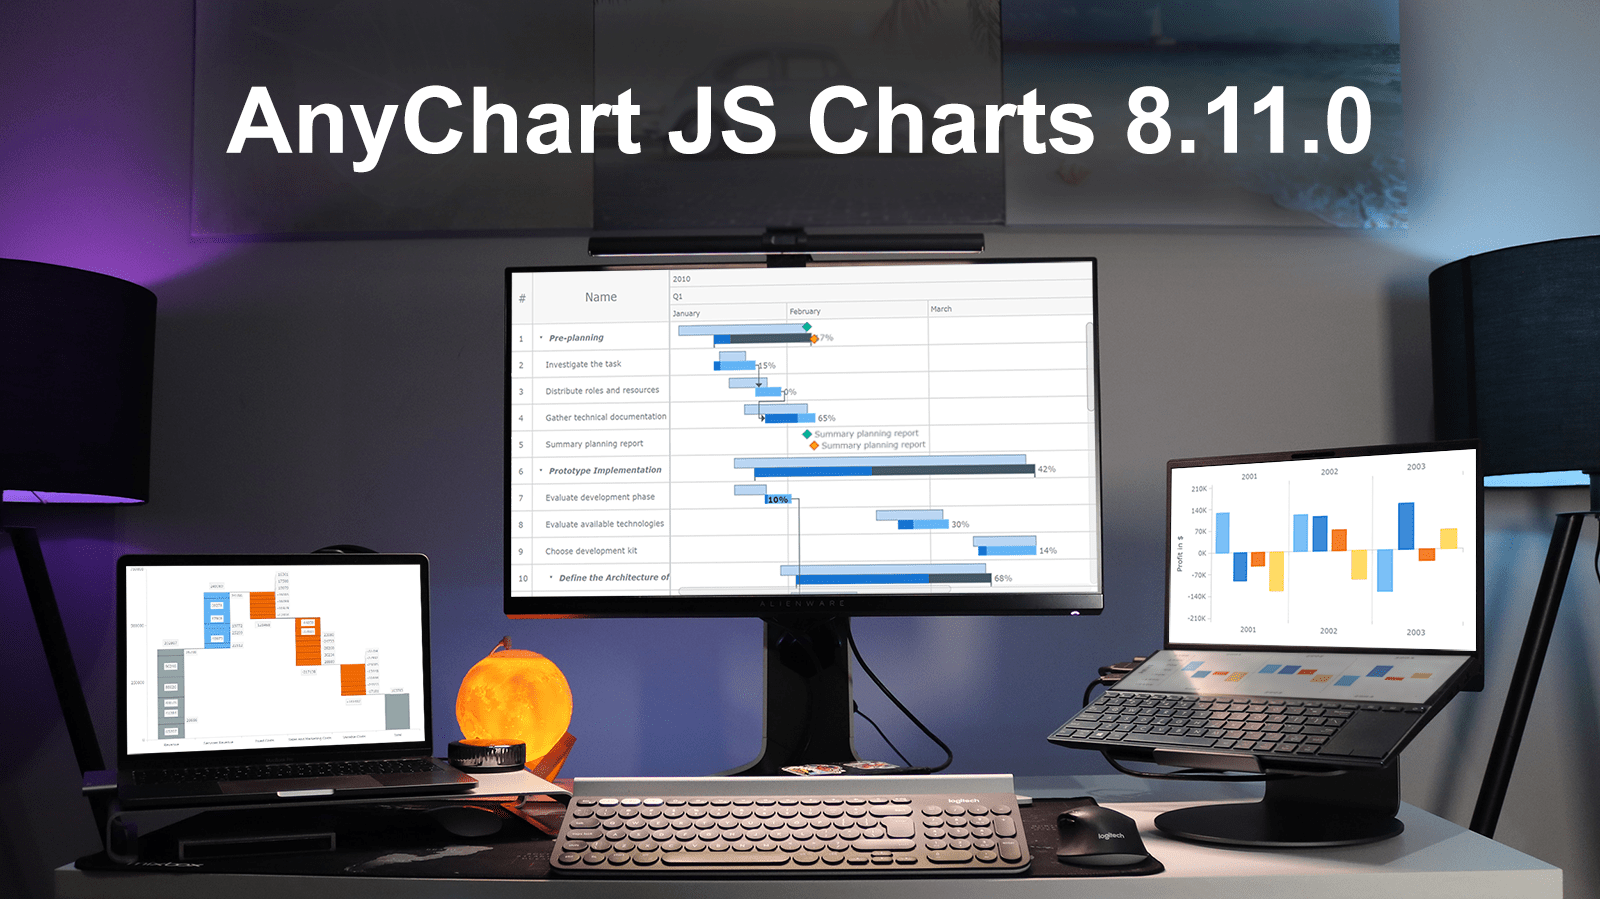 Excited to tell you we’ve just pushed a major update to our JavaScript charting library! The newly arrived features and improvements make our core solution even more flexible, adding awesome fresh capabilities designed to further help you on your data visualization development journey. Intrigued? Let us show what’s new in AnyChart JS Charts 8.11.0 right away!
»»» See What’s New in AnyChart 8.11.0! «««
- Categories: AnyChart Charting Component, AnyGantt, Gantt Chart, HTML5, JavaScript, News
- 3 Comments »
Building JS Resource Gantt Chart to Visualize Tokyo 2020 Paralympic Schedule
August 17th, 2021 by Shachee Swadia Smart resource allocation is a must to achieve a high level of operational efficiency. Aiming to ensure it, project management professionals commonly rely on a special form of data visualization called a Resource Gantt chart. Creating graphics like this may seem daunting at first sight. But I am here to show you an easy way to build Resource Gantt charts with JS using a compelling, topical example.
Resource Gantt charts, also known as simply Resource charts, consist of bars oriented along the horizontal axis. Each bar visualizes a resource used by an activity, with the length representing the duration while that resource is occupied by that activity. The left and right edges of the bars display the start and end times. The resources, or event labels, are listed on the left. The dates and times are shown in the header.
Tokyo 2020 Paralympic Games are just around the corner. So, I decided to visualize their sports program by venue. Follow along with this stepwise tutorial and you will learn how to create a cool JavaScript Resource Gantt chart visualizing the Tokyo 2020 Paralympic schedule!
Read the JS charting tutorial »
- Categories: AnyChart Charting Component, AnyGantt, Big Data, Business Intelligence, Gantt Chart, HTML5, JavaScript, JavaScript Chart Tutorials, Tips and Tricks
- No Comments »
Create Simple Gantt Chart Using JavaScript — Tutorial
September 4th, 2019 by Alfrick Opidi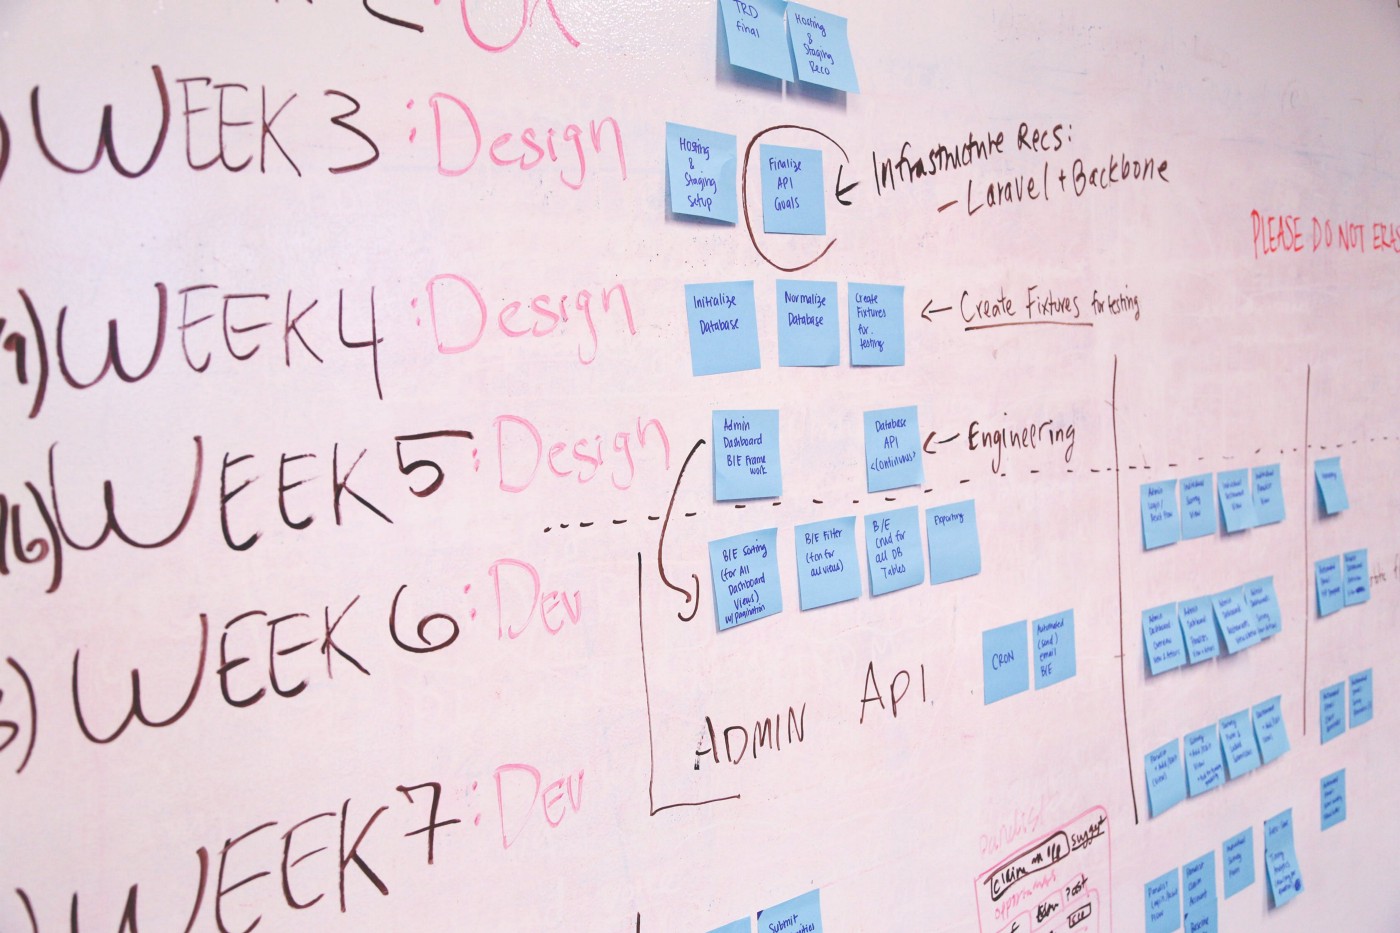
Use a JavaScript library to create a Gantt chart and take your project management efforts to the next level.
Earlier this year, my team was looking for a project management tool that could assist us in charting the various tasks related to our app development project against some specific timelines. After doing some research, we finally settled on Gantt charts. However, some people think Gantts are complicated to create. Not true! Thanks to numerous JavaScript chart libraries, data visualization is now simple, flexible, and embeddable.
In our situation, we settled on AnyChart’s JS Charts library because of its ease of use, extensive documentation, flexible code playground for trying out stuff, and other powerful features.
In this tutorial, I’ll walk you through how to create a simple interactive Gantt chart using this data visualization library. Here’s what we’ll be making and you can get the entire code for creating such a Gantt chart at the end of the tutorial:
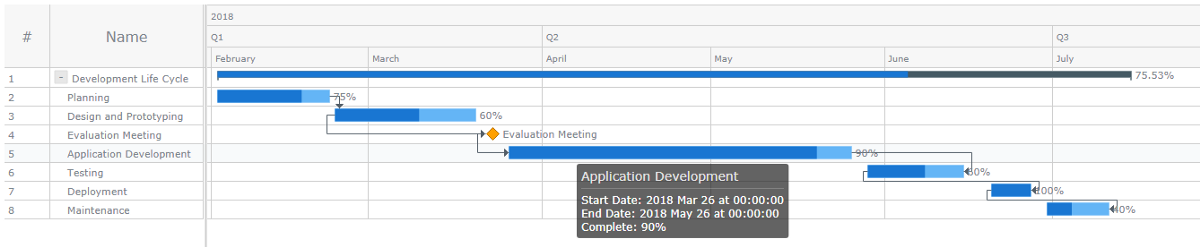
Read the JS charting tutorial »
- Categories: AnyChart Charting Component, AnyGantt, Big Data, Business Intelligence, Gantt Chart, HTML5, JavaScript, JavaScript Chart Tutorials, Tips and Tricks
- 3 Comments »