 Smart resource allocation is a must to achieve a high level of operational efficiency. Aiming to ensure it, project management professionals commonly rely on a special form of data visualization called a Resource Gantt chart. Creating graphics like this may seem daunting at first sight. But I am here to show you an easy way to build Resource Gantt charts with JS using a compelling, topical example.
Resource Gantt charts, also known as simply Resource charts, consist of bars oriented along the horizontal axis. Each bar visualizes a resource used by an activity, with the length representing the duration while that resource is occupied by that activity. The left and right edges of the bars display the start and end times. The resources, or event labels, are listed on the left. The dates and times are shown in the header.
Tokyo 2020 Paralympic Games are just around the corner. So, I decided to visualize their sports program by venue. Follow along with this stepwise tutorial and you will learn how to create a cool JavaScript Resource Gantt chart visualizing the Tokyo 2020 Paralympic schedule!
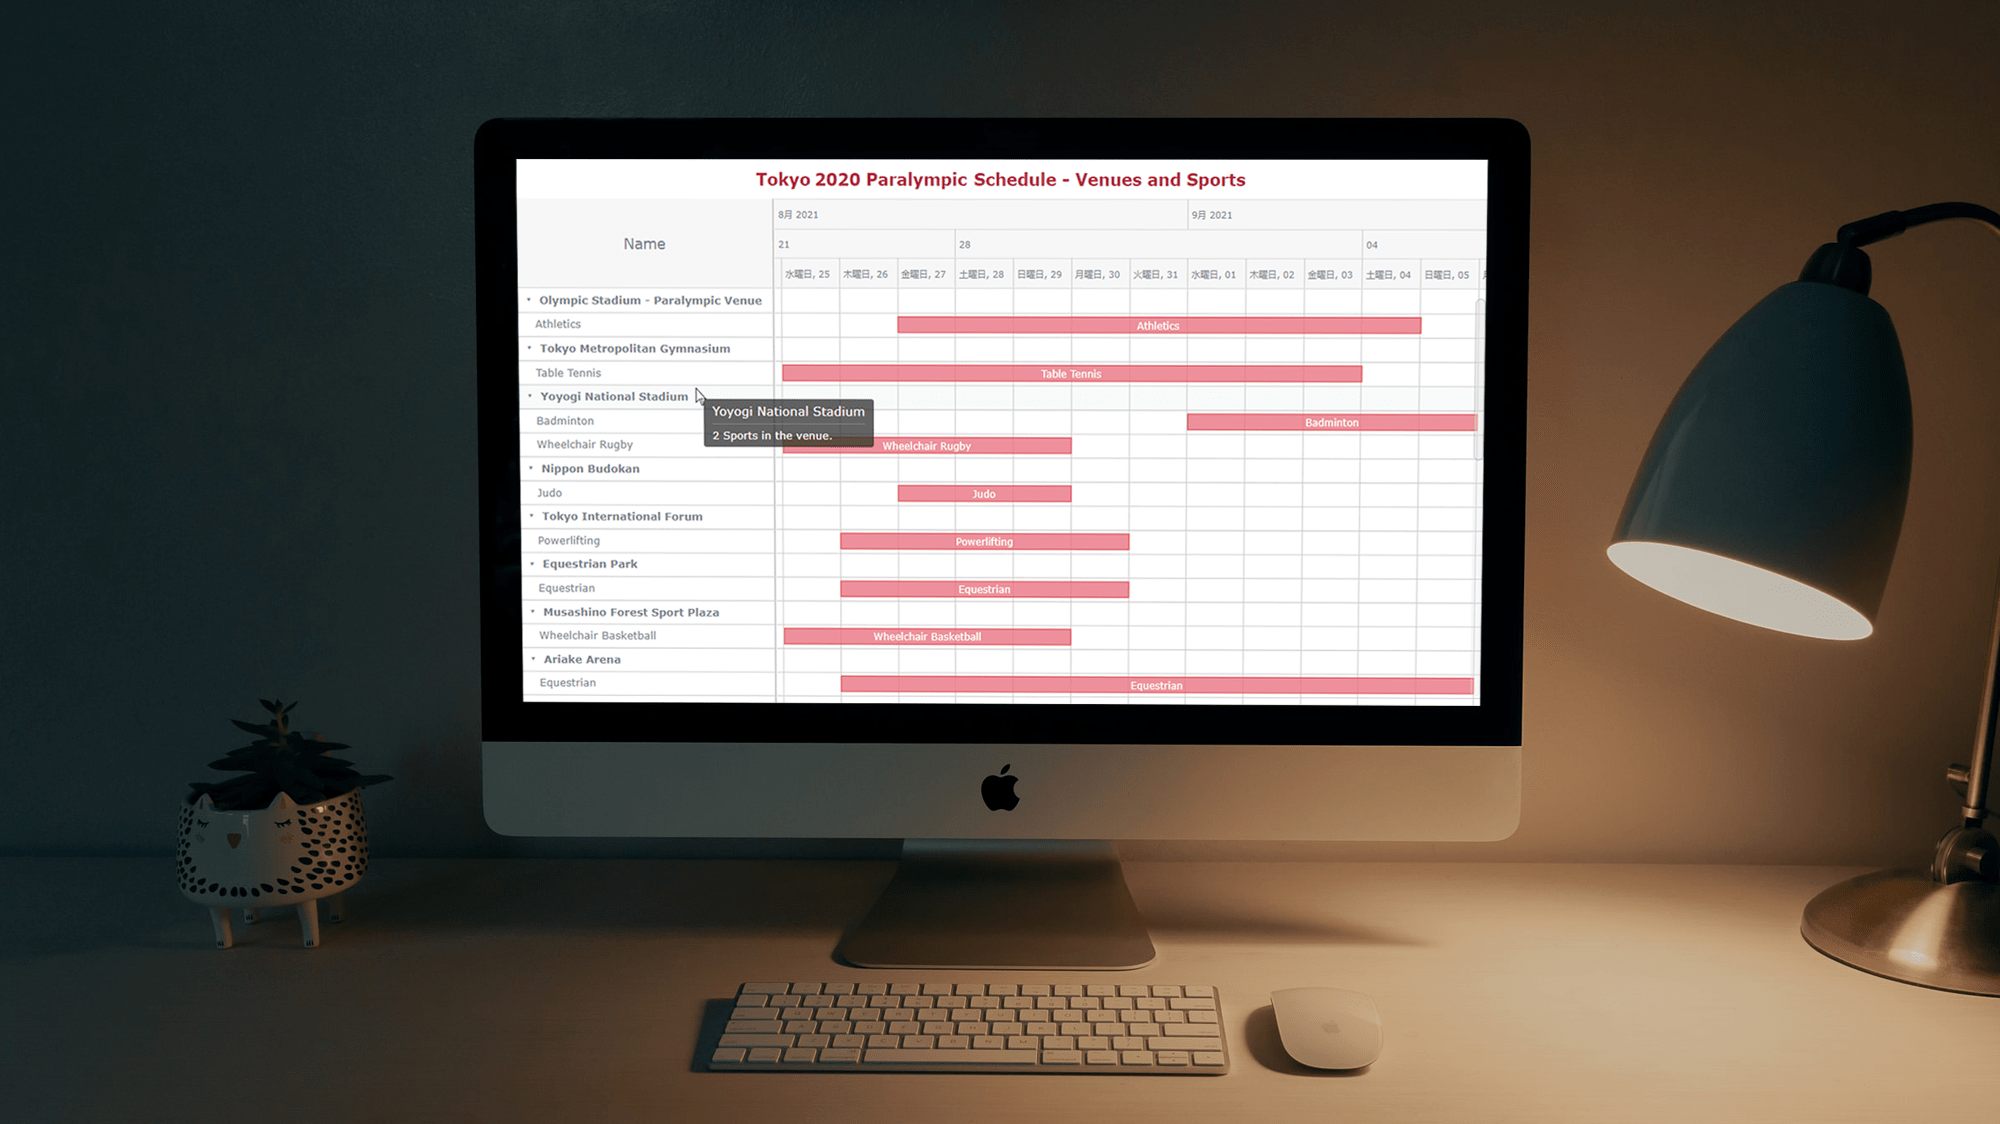
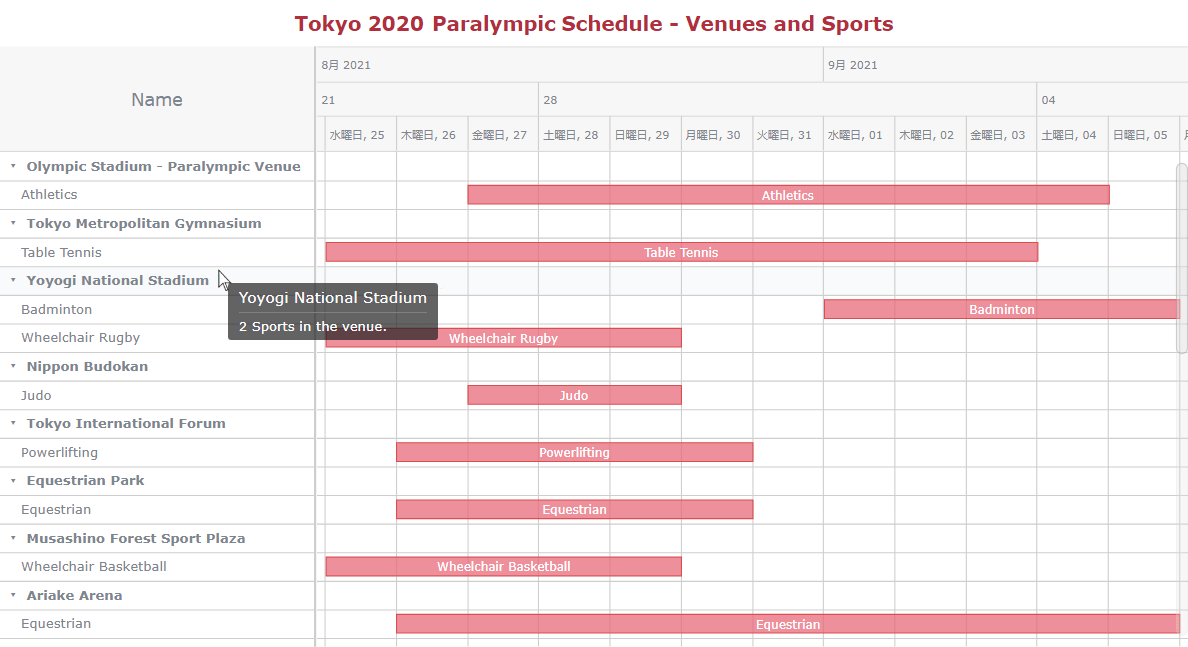
JS Resource Gantt Chart Preview
Below is a preview demonstrating how the final chart of the tutorial will look. Take a glance and then see how it will be built right before your eyes.
Creating Resource Gantt Chart with JavaScript
The basic process of building a JavaScript Resource Gantt chart, just like any other JS chart, can be split into four quite straightforward steps: create a page, include scripts, add data, and write some code for the visualization. So, let the games begin!
1. Create an HTML page
The first step is creating a blank HTML page and adding a <div> element to hold the Resource chart. This block element is given a unique id that will be used for later reference.
The width and height of the <div> are set to 100% to display the chart over the whole screen but this can be modified as per the requirements.
<html>
  <head>
    <title>JavaScript Resource Gantt Chart</title>
    <style type="text/css">
      html, body, #container {
        width: 100%; height: 100%; margin: 0; padding: 0;
      }
    </style>
  </head>
  <body>
    <div id="container"></div>
  </body>
</html>
2. Include the necessary scripts
The next step is to link the required JS scripts to create the chart we need.
Although there are many JavaScript charting libraries out there, far from all of them have Gantt charts, not to mention Resource Gantt charts specifically. In this tutorial, I use AnyChart JS Charts. This JavaScript (HTML5) charting library is a good fit here as it supports both Project and Resource Gantt charts out of the box under the AnyGantt umbrella. Plus, it has extensive documentation and useful examples that can be experimented with in an online JS chart code editor utility called Playground. The library is free for non-commercial use.
So, I will reference its corresponding files. For my JS Resource chart, I need to add AnyChart’s ‘Core’ and ‘Gantt’ modules, as well as the ‘Data Adapter’ module that will let me load the data in a straightforward manner. Remember that the script files are included in the <head> section of the web page.
<html>
  <head>
    <title>JavaScript Resource Gantt Chart</title>
    <script src="https://cdn.anychart.com/releases/8.10.0/js/anychart-core.min.js"></script>
    <script src="https://cdn.anychart.com/releases/8.10.0/js/anychart-gantt.min.js"></script>
    <script src="https://cdn.anychart.com/releases/8.10.0/js/anychart-data-adapter.min.js"></script>
    <style type="text/css">
      html, body, #container {
        width: 100%; height: 100%; margin: 0; padding: 0;
      }
    </style>
  </head>
  <body>
    <div id="container"></div>
    <script>
      // The code for the JS resource chart will be placed here.
    </script>
  </body>
</html>
3. Add the data
AnyChart supports multiple ways of loading data to charts like CSV, JSON, Google Sheets, etc Here, I go with JSON.
I have already taken data about the Paralympic venues from the official website and pre-processed it to include relevant fields for the JS Resource Gantt chart. You can download the JSON file here.
Loading the JSON data from the file:
anychart.data.loadJsonFile("https://gist.githubusercontent.com/shacheeswadia/21da3da501982400b8ca35690b17ea5a/raw/d17e3774c6db1502b5d95677a5656ecc43f24526/resourceChartData.json", function (data) {})4. Write the code to build the chart
So, the qualifying steps are all done, and now is the time for the main event. One of the best parts about using a robust JS charting library is that a basic functional chart is created in just a few lines of code.
Before anything else, I put all the code inside the anychart.onDocumentReady() function to ensure that the page is fully loaded before the code is executed. Next, the data is loaded using the anychart.data.loadJsonFile() function. A Resource Gantt chart requires the data in a tree format. This is done by creating a data tree. After this, the chart instance is created and the data is set for the chart. To ensure that the bar elements fit into the screen, the fitAll function is specified.
// create a data tree
var treeData = anychart.data.tree(data, "as-tree");

// create a resource gantt chart
var chart = anychart.ganttResource();

// set the data
chart.data(treeData);

// fit the elements to the width of the timeline
chart.fitAll();
The following thing is absolutely optional but in this case, it will make the visualization look even more neat and cute:
// set the position of the splitter to match the first column
chart.dataGrid().fixedColumns(true);
The final steps are setting the container id to the previously declared <div> reference and drawing the resulting JS-based Resource Gantt chart.
// set the container id
chart.container("container");

// draw the chart
chart.draw();
Isn’t this absolutely unbelievable? A functional, beautiful, interactive JavaScript Resource Gantt chart is built in so few lines of code!
Look at this initial version with the HTML, CSS, and JS code on AnyChart Playground.
The full source code of this Resource chart is also below, just in case:
<html>
  <head>
    <title>JavaScript Resource Ganntt Chart</title>
    <script src="https://cdn.anychart.com/releases/8.10.0/js/anychart-core.min.js"></script>
    <script src="https://cdn.anychart.com/releases/8.10.0/js/anychart-gantt.min.js"></script>
    <script src="https://cdn.anychart.com/releases/8.10.0/js/anychart-data-adapter.min.js"></script>
    <style type="text/css">
      html, body, #container {
        width: 100%; height: 100%; margin: 0; padding: 0;
      }
    </style>
  </head>
  <body>
    <div id="container"></div>
    <script>
      anychart.onDocumentReady(function () {
        anychart.data.loadJsonFile("https://gist.githubusercontent.com/shacheeswadia/21da3da501982400b8ca35690b17ea5a/raw/d17e3774c6db1502b5d95677a5656ecc43f24526/resourceChartData.json", function (data) {

          // create a data tree
          var treeData = anychart.data.tree(data, "as-tree");

          // create a resource chart
          var chart = anychart.ganttResource();

          // set the data
          chart.data(treeData);

          // fit the elements to the width of the timeline
          chart.fitAll();

          // set the position of the splitter to match the first column
          chart.dataGrid().fixedColumns(true);

          // set the container id
          chart.container("container");

          // draw the chart
          chart.draw();

        });
      });
    </script>
  </body>
</html>
Customizing JS Resource Gantt Chart
There are a variety of customization options that can help make the just-built JavaScript Resource Gantt chart more exciting and personalized. Right now, I will tweak some code to improve it and walk you through each of the changes. So get ready for some more advanced resource data visualization action here!
A. Add a title
It is always a good idea to properly name a chart, indicating what kind of data the visualization is representing. I add a title to our Resource chart along with some formatting.
// enable and configure the chart title
var title = chart.title();
title.enabled(true);
title
  .text("Tokyo Paralympic 2020 Schedule")
  .fontSize(18)
  .fontWeight(600)
  .fontColor("#b32e3c")
  .padding(10);
B. Change the colors of the bars
The default color for the bars is good but I decided to use the color palette of the Paralympics site. This gives the chart a nice customized look.
// customize the color of the bars
var elements = chart.getTimeline().elements();
elements.normal().fill("#e96a7b 0.75");
elements.normal().stroke("#db4e50");
C. Adjust the height of the rows
Just as a simple modification to enhance the JavaScript-based Resource Gantt chart we already have, I increase the row height for each data row and also for the header.
// set the row height
chart.defaultRowHeight(25);

// set the header height
chart.headerHeight(95);
Check out the resulting new version of the interactive JS Resource Gantt chart right below! It is available on AnyChart Playground.
D. Enhance the tooltip
The default tooltip of our Resource Gantt chart already shows the necessary information. But I want to apply some more customizations so that it displays relevant information based on where the user hovers. Thanks to the possibility of using functions and access to data, everything in the tooltips can be nicely customized. See the comments in the code for more details on how what is done.
// enable html for the data grid tooltip
chart.dataGrid().tooltip().useHtml(true);

// configure the tooltips of the timeline
chart.getTimeline().tooltip().useHtml(true);

chart.getTimeline().tooltip().title(false);
chart.getTimeline().tooltip().separator(false);

chart.getTimeline().tooltip().format(function(e){
  var depth = e.item.meta('depth');
  var tooltipText;

  // when hovering a venue row
  // show the number of sports in the venue
  if (depth==0){
    tooltipText = e.item.numChildren() + " Sports in the venue.";
  } else {
    if (typeof e.period === 'undefined') {
      // when hovering an event row
      // show the sport and the number of events
      var events = e.item.get('periods').length;
      tooltipText = "<span style='font-weight:600;font-size:12px'>" +
      events + " " + e.name + " event(s).</span>";
    } else {
	// when hovering an event bar
	// show the start and end of the event
	start = anychart.format.dateTime(e.start, "dd MMM");
	end = anychart.format.dateTime(e.end, "dd MMM");

	tooltipText = "<span style='font-weight:600;font-size:12px'>" +
	start + "-" + end + " </span>";
    }
  }
  return tooltipText;
});

chart.dataGrid().tooltip().format(function(e){
  // different tooltips for venues and sports
  // in the data grid
  var depth = e.item.meta('depth');
  var tooltipText;

  // the number of sports for venues
  if (depth==0){
    tooltipText = e.item.numChildren() + " Sports in the venue.";
  } else {
    // the number of events for sports
    tooltipText = "<span style='font-weight:600;font-size:12px'>" +
    e.name + ": " + e.item.get("periods").length + " event(s) in the  venue. </span>"
  }
  return tooltipText;
});
E. Modify the column width
Next, I see that the very first column is not really required for this Resource chart-based schedule of the Paralympic events. So, I remove that ONE and set a fixed width to the labels column.
// disable the first data grid column
chart.dataGrid().column(0).enabled(false);

// set the width of the labels column
chart.dataGrid().column(1).width(285);
F. Add a locale file to get Japanese texts
A really cool personalization is to localize the date/time text to Japanese since the 2020 Summer Paralympics are held in Japan. I do this by, first, adding the script file in the <head> section and, second, setting the format of the output locale to Japanese. Easy JS Resource Gantt chart localization in action:
<script src="https://cdn.anychart.com/releases/8.10.0/locales/ja-jp.js"></script>

…

// set the japanese locale
anychart.format.outputLocale('ja-jp');
G. Format the labels
One last thing for this tutorial. To improve the Resource chart aesthetically and enhance its readability, I make the venue labels bold using HTML.
// set the text of the first data grid column
var column_1 = chart.dataGrid().column(1);
column_1.labels()
  .useHtml(true);

// format labels depending on whether it is a venue or a sport
column_1.labels().format(function(e) {
  // decision based on a depth in hierarchy
  var depth = e.item.meta('depth');
  var style = (depth==0)?'bold':'400';
  return "<span style='font-size:12px;font-weight:" + style + "'>" +  e.name + " </span>";
});
See how cool the final version of the interactive JS Resource Gantt chart is! Check it out with the entire code and play with it more on AnyChart Playground.
Conclusion
A Resource Gantt chart is a useful and engaging visualization to know and as you can see, creating it using an appropriate JavaScript charting library is quite effortless.
There are many different charts available in the AnyChart library, so feel free to check out the various other options here. If you want to keep looking into data visualization development for project management, you may also like to find out how to create a Project Gantt chart in a nice tutorial just next door.
Please drop a comment if you have any questions or suggestions. As the world of sports teaches us, participation is what matters. So go ahead and create lots of cool charts!
We at AnyChart would like to thank Shachee Swadia, a freelance data designer, for creating this wonderful JS Resource Gantt Chart tutorial for our blog.
Let us know if you want to make an awesome guest post.
Look at the other JavaScript charting tutorials on our blog.
- Categories: AnyChart Charting Component, AnyGantt, Big Data, Business Intelligence, Gantt Chart, HTML5, JavaScript, JavaScript Chart Tutorials, Tips and Tricks
- No Comments »