Remembering 2023, Welcoming 2024
January 10th, 2024 by AnyChart Team Happy New Year! As the last echoes of festive celebrations fade away and we dive into the adventures of 2024, let’s bid a final farewell to 2023 by reflecting on its best moments.
For us at AnyChart, it was a remarkable year:
- Celebrated our 20th anniversary — indeed, we’ve been innovating since 2003.
- Awarded as the Best in Data Analytics & Visualization.
- Introduced more cool features and tweaks to our JavaScript charting library and other solutions.
- Launched new powerful extensions for Qlik Sense, with the Decomposition Tree taking center stage — join us in reviewing our year in the Qlik ecosystem.
- Reached some noteworthy milestones — now boasting over 80 JS charting tutorials on our blog, our Android charting library gleaming with over 2K stars on GitHub, and our social media family expanded to over 20K followers.
Looking ahead, our dedication remains unwavering: to empower your data viz and analytics journey with new and better tools. Thank you for growing with us, and cheers to your continued success, brighter and bolder in 2024!
- Categories: AnyChart Charting Component, AnyGantt, AnyMap, AnyStock, Big Data, Blogroll, Business Intelligence, Charts and Art, Dashboards, Financial Charts, Gantt Chart, HTML5, JavaScript, News, Qlik, Stock Charts
- No Comments »
Unwrapping Enhanced Interactivity for Calendar and Circle Packing Charts in AnyChart 8.12.0
December 7th, 2023 by AnyChart Team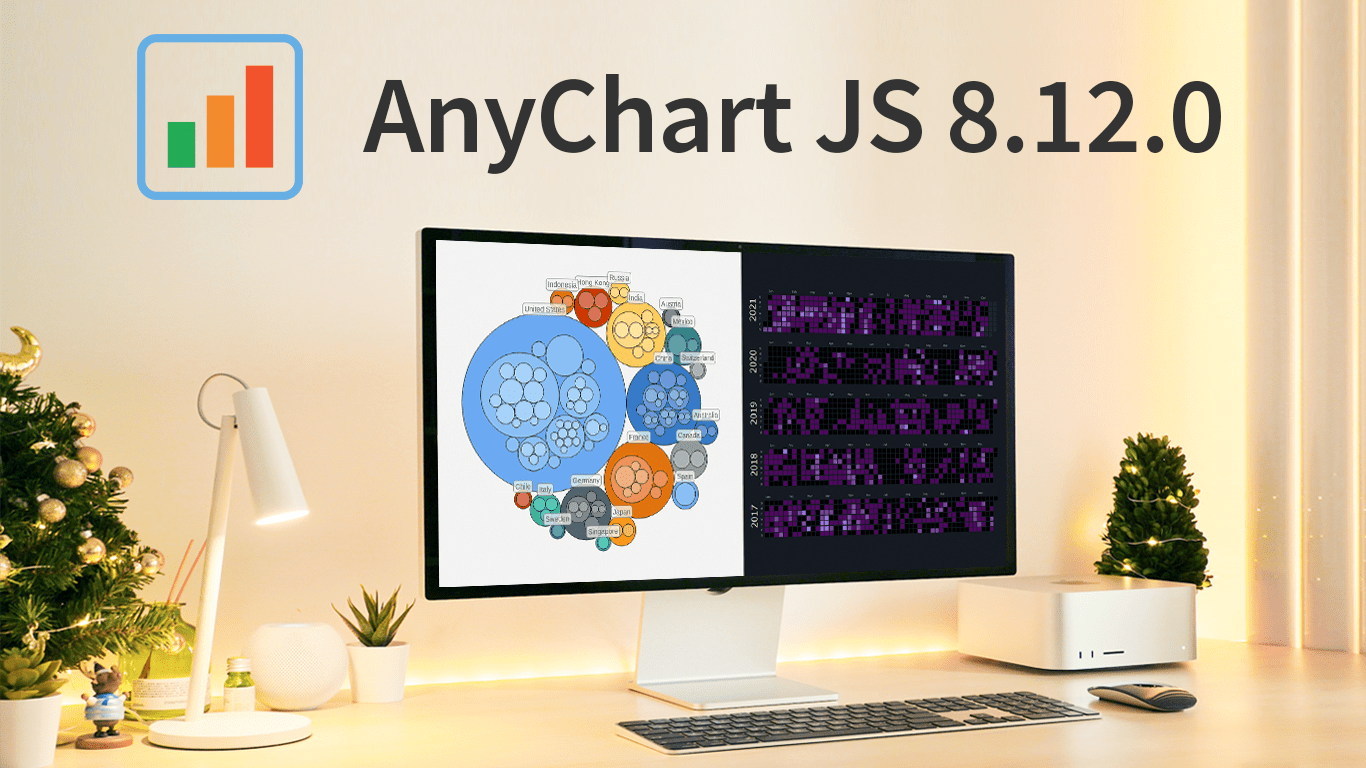 As the magic holiday season approaches, we’re thrilled to unwrap our latest gift of the year — AnyChart 8.12.0, the newest version of our powerful JavaScript charting library. Packed with various bug fixes and improvements, this release introduces a remarkable feature for Calendar and Circle Packing charts — interactivity events. Learn more about it and upgrade right now!
- Categories: AnyChart Charting Component, AnyGantt, AnyMap, AnyStock, Big Data, Business Intelligence, Dashboards, Financial Charts, Gantt Chart, HTML5, JavaScript, News, Stock Charts
- No Comments »
OHLC Chart: Understanding & Creating in JavaScript Step-by-Step
November 13th, 2023 by Awan Shrestha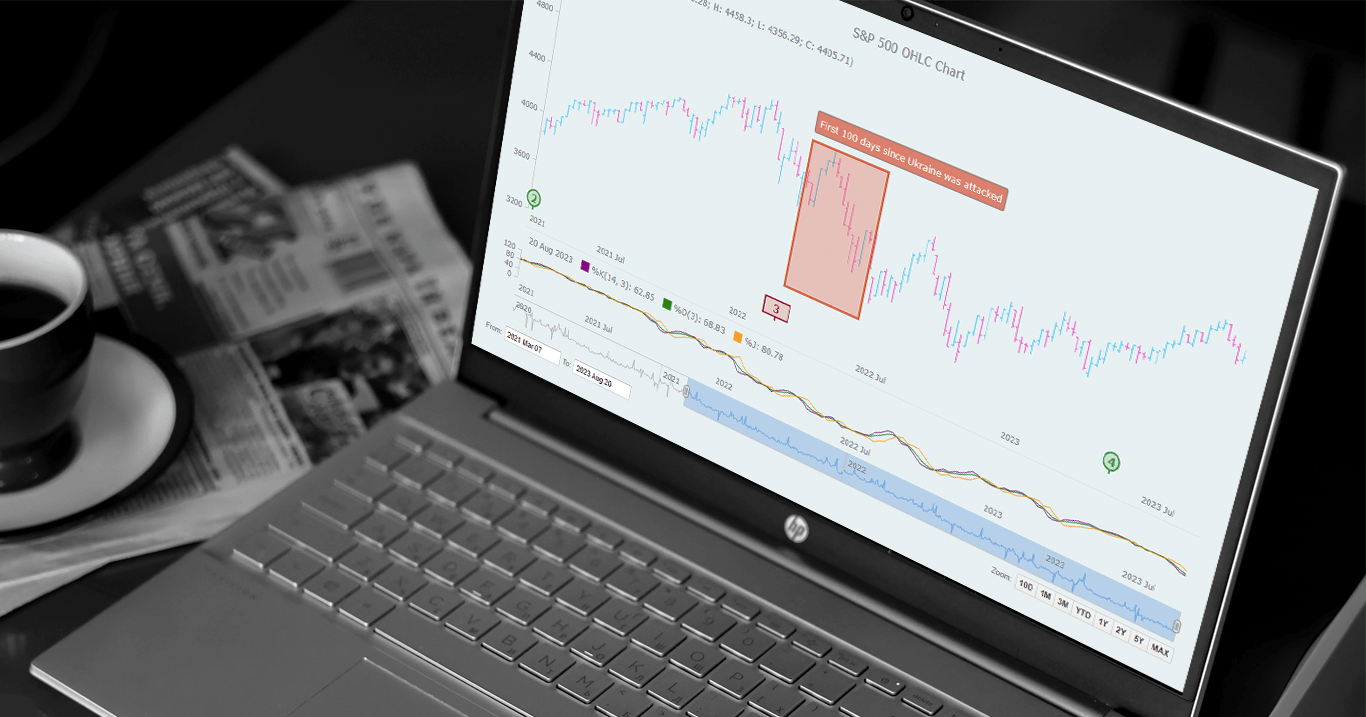 Unearthing insights from vast datasets is an intricate blend of art and science. In the realm of financial analysis, a pivotal instrument for visually exploring complex data is the Open-High-Low-Close (OHLC) chart. This tutorial is your roadmap to swiftly crafting your OHLC chart using JavaScript, a step-by-step journey. We’ll harness S&P 500 data, and by the end of this article, you’ll possess the skills to orchestrate visual stock analysis adeptly.
Read the JS charting tutorial »
- Categories: AnyChart Charting Component, AnyStock, Big Data, Business Intelligence, Financial Charts, HTML5, JavaScript, JavaScript Chart Tutorials, Stock Charts, Tips and Tricks
- No Comments »
Stock Chart Creation in JavaScript: Step-by-Step Guide
September 5th, 2023 by Shachee Swadia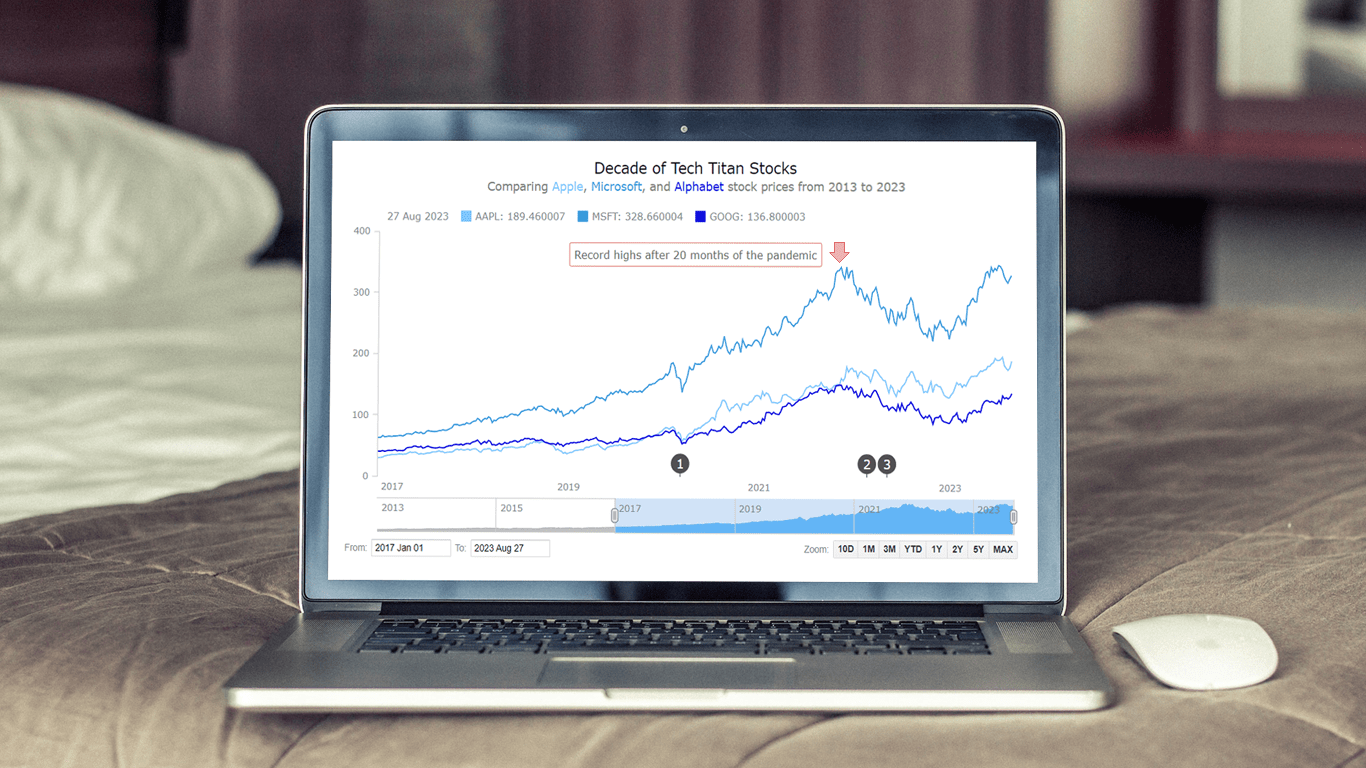 Chances are, you’ve come across various stock charts, whether you’re a seasoned trader or not. If crafting your data graphics piques your interest, you’re in the right place. Welcome to this user-friendly tutorial on building an interactive stock chart using JavaScript!
The JS stock chart we’ll create by the end of this guide will visually compare stock prices for three tech giants — Apple, Microsoft, and Google (Alphabet) — over the past decade. It’s a robust example to illustrate the stock charting process and the power of market data visualization.
So, hop on board as we explore the world of stock charts and learn how to create one from scratch.
Read the JS charting tutorial »
- Categories: AnyChart Charting Component, AnyStock, Big Data, Financial Charts, HTML5, JavaScript, JavaScript Chart Tutorials, Stock Charts, Tips and Tricks
- No Comments »
Exciting New Technical Indicators & More in AnyChart JS Charts 8.11.1
May 10th, 2023 by AnyChart Team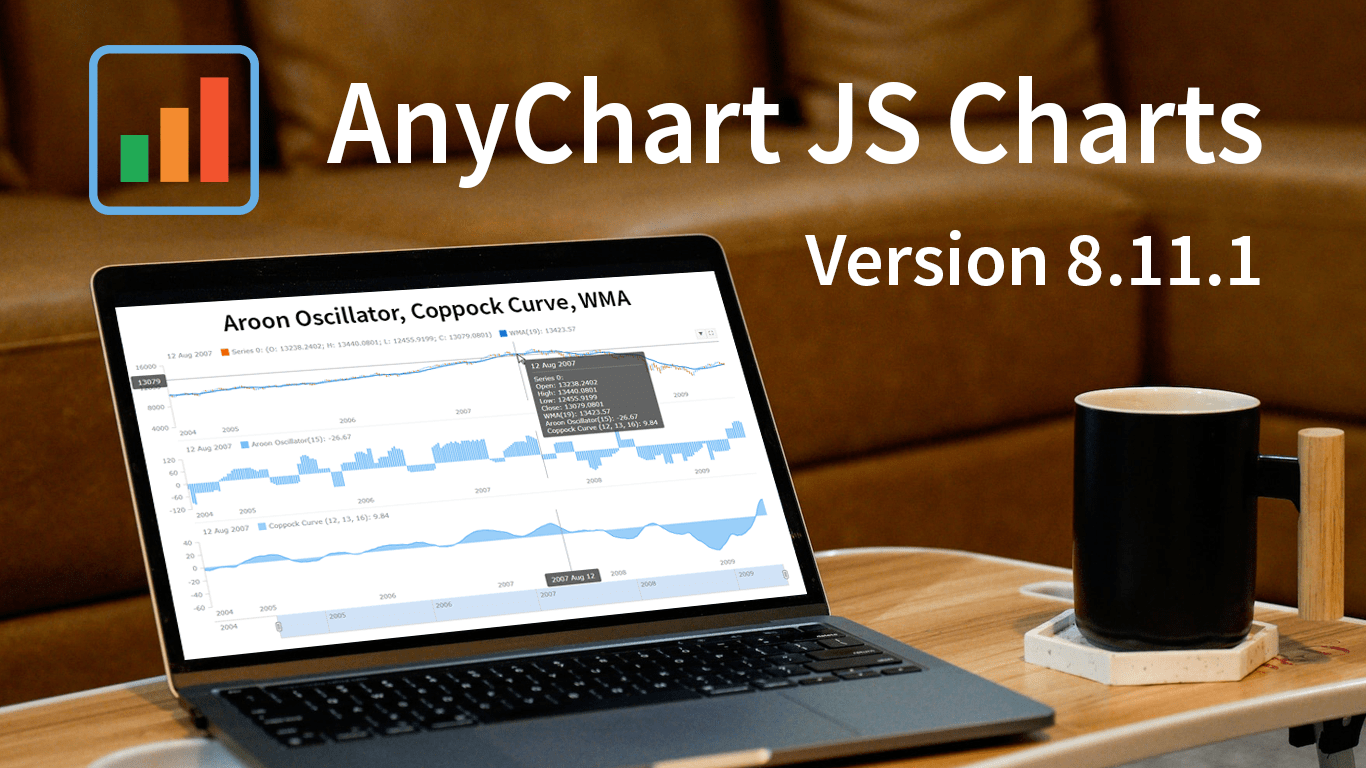 Great news! We’ve just launched version 8.11.1 of our JS charting library, and it comes with some awesome new features and improvements. Our top stars this time around are three new technical indicators that are now available straight out of the box: Aroon Oscillator, Coppock Curve, and WMA. That’s right, now in addition to the dozens of indicators already supported in our stock charts, these new options provide even more ways to improve technical analysis.
But that’s not all! We’ve also updated some of the geo maps in our collection, making them more accurate and detailed. Plus, we’ve squashed some pesky bugs in our Gantt, stock, map, and basic charts, ensuring an even smoother experience when handling specific, advanced cases.
Take a quick tour of the new indicators to discover how they can enhance technical analysis. We’ll also give you a brief overview of the other updates, so you can get the most out of our latest release. Let’s go explore!
- Categories: AnyChart Charting Component, AnyGantt, AnyMap, AnyStock, Big Data, Business Intelligence, Dashboards, Financial Charts, Gantt Chart, HTML5, JavaScript, News, Stock Charts
- No Comments »
How to Create Candlestick Chart with JavaScript for Stock Analysis
May 2nd, 2023 by Awan Shrestha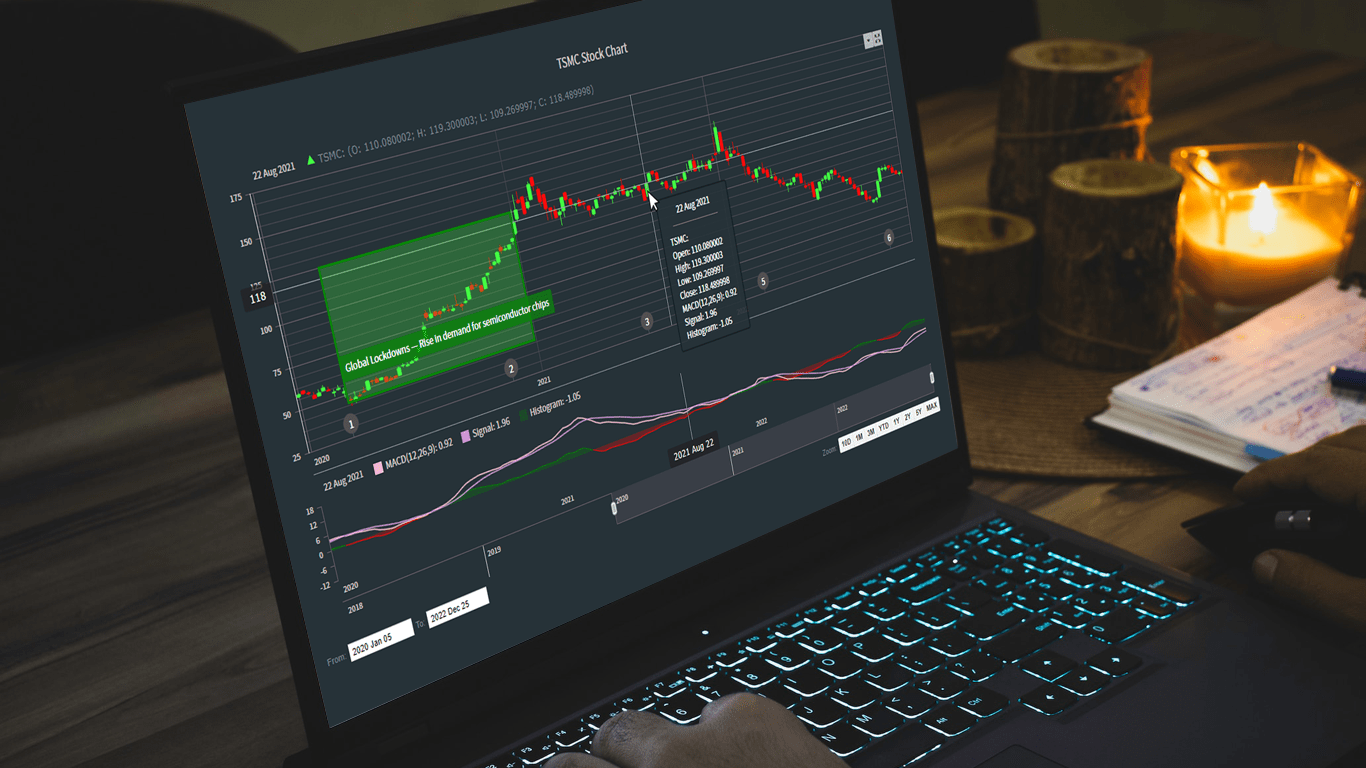 Candlestick charts are a fantastic data visualization tool for tracking the price movements of stocks over a period of time. In this tutorial, I'll show you how to create your own candlestick chart using JavaScript.
We’ll be using TSMC (Taiwan Semiconductor Manufacturing Company) as an example, as they're the largest contract chip maker in the world and have been making waves in the stock market recently.
By the end of this tutorial, you'll be able to create your own JS candlestick charts and analyze stock trends like a pro. So, let's get started and dive into the exciting world of data visualization with JavaScript!
Read the JS charting tutorial »
- Categories: AnyChart Charting Component, AnyStock, Big Data, Financial Charts, HTML5, JavaScript, JavaScript Chart Tutorials, Tips and Tricks
- 2 Comments »
CEO Anton Baranchuk Receives 2023 DEVIES Award for AnyChart
February 16th, 2023 by AnyChart Team Last night was amazing: Anton Baranchuk, CEO and Co-founder of AnyChart, received our award for Best in Data Analytics and Visualization at DeveloperWeek’s DEVIES Awards ceremony in Oakland, California!
Check out some photos from the event in this quick story!
- Categories: AnyChart Charting Component, AnyGantt, AnyMap, AnyStock, Big Data, Business Intelligence, Financial Charts, Gantt Chart, GraphicsJS, HTML5, JavaScript, News, Qlik, Stock Charts
- No Comments »
AnyChart Named Best in Data Analytics & Visualization ?
February 3rd, 2023 by AnyChart Team We’re proud to announce that AnyChart has won a prestigious 2023 DEVIES Award in the Data Analytics & Visualization category! Many thanks to the jury and congratulations to all our partners and customers!
Celebrating 20 years in the market this year, we at AnyChart have been working hard to develop the best-in-class data visualization solutions. And we will keep innovating and excelling!
The DEVIES Awards are the definitive annual awards for the software industry, recognizing outstanding design, engineering, and innovation in developer technology across multiple categories. This year’s winners were selected from record-high hundreds of nominations by an expert-led panel of the DevNetwork Advisory Board, including representatives of Accenture, DigitalOcean, EA, Google, IBM, Salesforce, and other great companies.
- Categories: AnyChart Charting Component, AnyGantt, AnyMap, AnyStock, Big Data, Business Intelligence, Dashboards, Financial Charts, Gantt Chart, GraphicsJS, HTML5, JavaScript, News, Oracle Apex, Qlik, Stock Charts, Success Stories
- 2 Comments »
Building Stock Chart with JavaScript
February 24th, 2022 by Shachee Swadia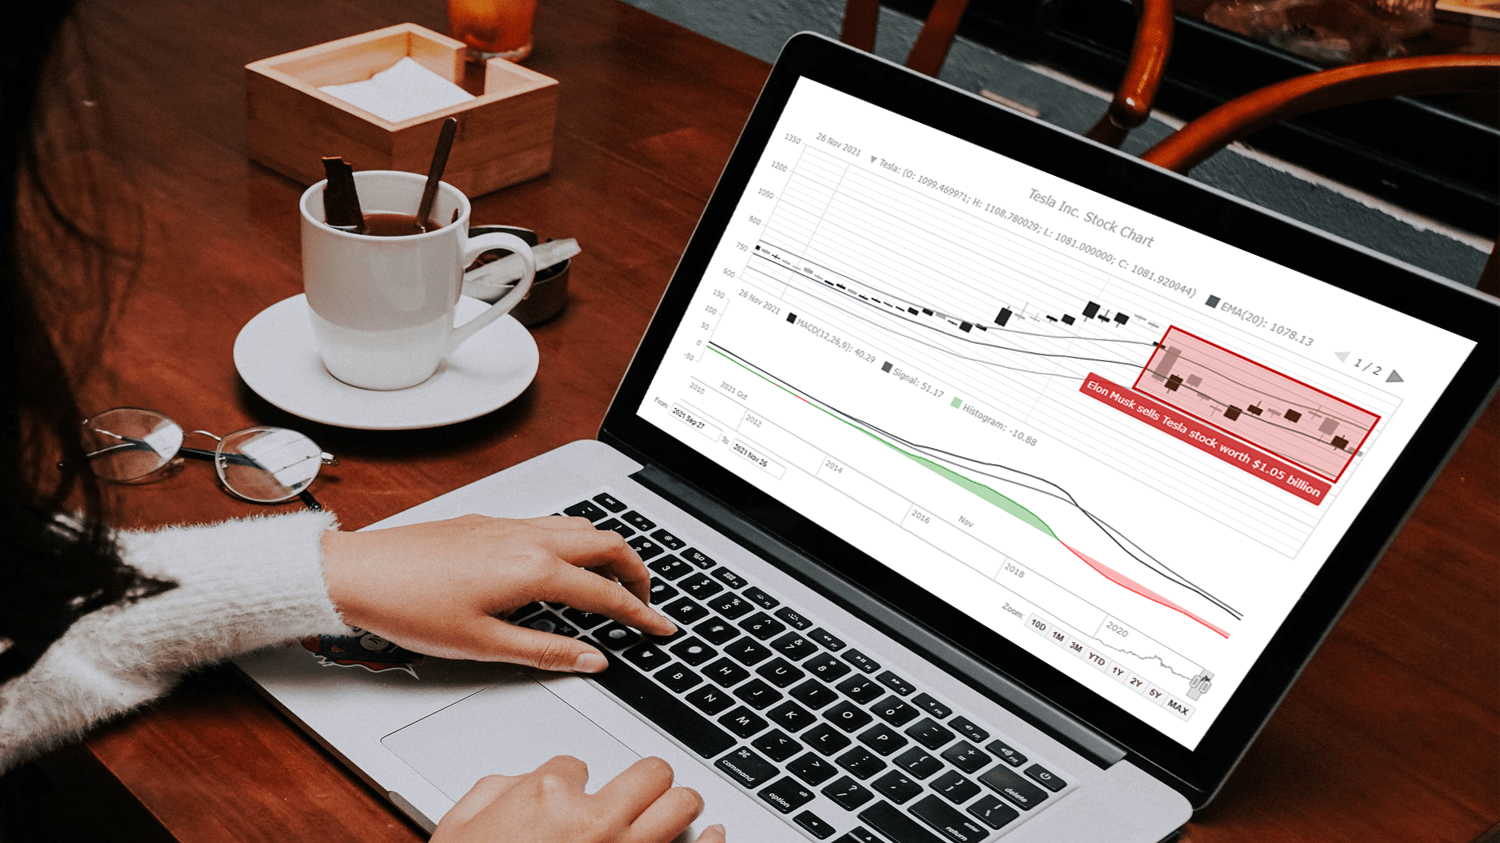 Data visualization is vastly applied in various fields. One such domain is financial trading, where stock charts are essential for smart market data analysis and decision making. Whether you invest in stocks or not, I am pretty sure that you have come across such graphics or even might need to build one right now. So, would you like to know how to make a stock chart? I’m ready to show you an easy path using the Tesla stock price data and JavaScript! Come along with me throughout this tutorial and you’ll learn how to quickly create elegant, interactive JS stock charts like the one you see in the picture.
Read the JS charting tutorial »
- Categories: AnyChart Charting Component, AnyStock, Big Data, Financial Charts, HTML5, JavaScript, JavaScript Chart Tutorials, Stock Charts, Tips and Tricks
- No Comments »
How to Create Financial Open-High-Low-Close (OHLC) Chart Using JavaScript
September 7th, 2021 by Shachee Swadia A stepwise guide on how to create interactive financial charts in the form of an OHLC chart. Visualizing the stock prices of Amazon over the course of Jeff Bezos’s tenure as the CEO.
Financial charts are especially useful to represent large amounts of data and identify trends. Would like to learn one such cool financial chart called the OHLC chart that visualizes stock price movement?
Read the JS charting tutorial »
- Categories: AnyChart Charting Component, AnyStock, Big Data, Financial Charts, HTML5, JavaScript, JavaScript Chart Tutorials, Stock Charts, Tips and Tricks
- No Comments »