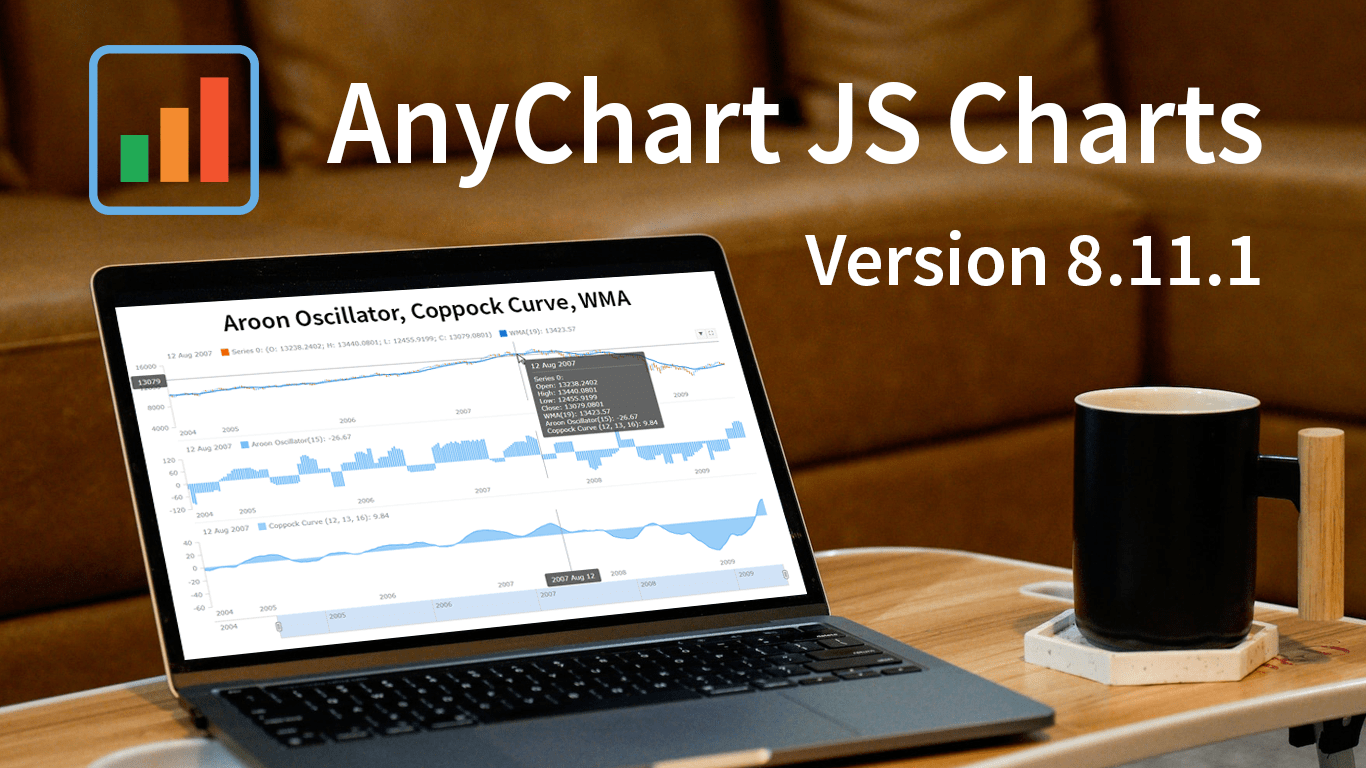
 Great news! We’ve just launched version 8.11.1 of our JS charting library, and it comes with some awesome new features and improvements. Our top stars this time around are three new technical indicators that are now available straight out of the box: Aroon Oscillator, Coppock Curve, and WMA. That’s right, now in addition to the dozens of indicators already supported in our stock charts, these new options provide even more ways to improve technical analysis.
But that’s not all! We’ve also updated some of the geo maps in our collection, making them more accurate and detailed. Plus, we’ve squashed some pesky bugs in our Gantt, stock, map, and basic charts, ensuring an even smoother experience when handling specific, advanced cases.
Take a quick tour of the new indicators to discover how they can enhance technical analysis. We’ll also give you a brief overview of the other updates, so you can get the most out of our latest release. Let’s go explore!
Aroon Oscillator
The Aroon Oscillator makes it easy to measure the strength of a trend by subtracting the Aroon Down from the Aroon Up. Aroon Up measures the number of periods since the highest high within the lookback period, while Aroon Down measures the number of periods since the lowest low. The Aroon Oscillator ranges between -100 and +100. A reading above 50 indicates a strong uptrend, while a reading below -50 indicates a strong downtrend.
- Add the Aroon Oscillator using the aroonOscillator() method.
- Check out an example of Aroon Oscillator usage here.
Coppock Curve
The Coppock Curve helps identify potential long-term buying opportunities in the stock market by combining the 11-month and 14-month rate of change and smoothing it with a 10-period WMA. The Coppock Curve was originally designed for the S&P 500, but it can be applied to any index, stock, or ETF. A reading above zero indicates a buying opportunity, while a reading below zero indicates a selling opportunity.
- Add the Coppock Curve using the coppockCurve() method.
- Check out an example of Coppock Curve usage here.
Weighted Moving Average (WMA)
The Weighted Moving Average (WMA) is especially useful for analyzing short-term trends in stock prices by placing a greater emphasis on recent data points. A WMA is calculated by multiplying each data point by a weight and then dividing the sum of the products by the sum of the weights. The weights are determined by the number of periods in the WMA. For example, a 5-period WMA would have weights of 5, 4, 3, 2, and 1. This indicator is especially useful for identifying changes in short-term trends.
Improvements and Bugfixes
We hope these new indicators will be a valuable addition to your technical analysis toolkit. Now, let’s take a quick look at some of the other updates — improvements and bugfixes — in the latest release of AnyChart JS Charts.
- In JS Maps, we’ve made significant improvements to the New York, Ghana, and India maps, providing even more accurate and detailed geographic data.
- In Basic JS Charts, we’ve fixed several issues, including those with zIndex, droplines serialization, and CSV export in surface charts; network graph arrows; and label annotation.
- In JS Stock Charts, we’ve resolved issues with point-related events, RSI calculation, and label annotation.
- Finally, in JS Gantt Charts, we’ve addressed the issue of resource labels cropping or overlapping, providing an even smoother experience in advanced use cases.
At AnyChart, we’re always working hard to enhance our JS charting library and offer you the best possible tools for data visualization. We’re excited to bring you these new updates that will help you create stunning interactive graphics that truly breathe life into your data.
And if you have any ideas or suggestions for future updates, we’re all ears! Our users are at the heart of everything we do, and we’re committed to delivering the features and functionality you need to succeed.
Happy JavaScript charting!
- Categories: AnyChart Charting Component, AnyGantt, AnyMap, AnyStock, Big Data, Business Intelligence, Dashboards, Financial Charts, Gantt Chart, HTML5, JavaScript, News, Stock Charts
- No Comments »