Amazing New Charts and Maps That Tell Stories — DataViz Weekly
November 5th, 2021 by AnyChart Team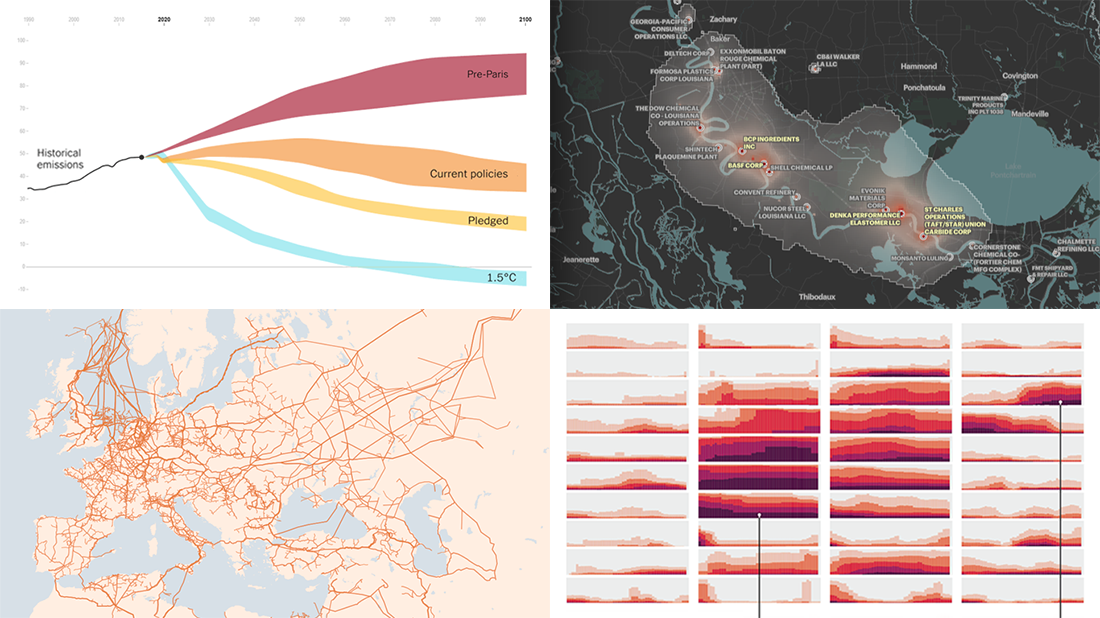 Ready for a new portion of amazing charts and maps for inspiration? We’ve got it for you right here! Join us today on DataViz Weekly as we look at four new visualizations that definitely deserve your attention.
- Greenhouse gas emission pathways and climate goals — The New York Times
- U.S. drought extent patterns by region since 2000 — Scientific American
- Cancer-causing industrial air pollution across the United States — ProPublica
- European natural gas pipeline infrastructure — The Financial Times
- Categories: Data Visualization Weekly
- No Comments »
New Cool Graphics From Around the Web — DataViz Weekly
July 10th, 2020 by AnyChart Team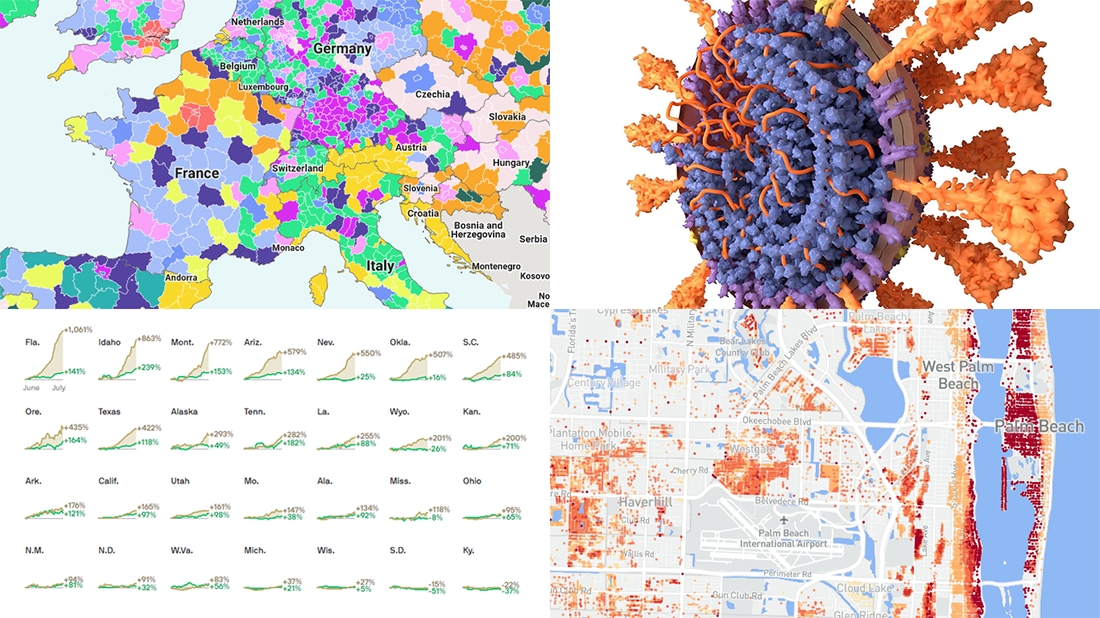 It’s Friday and we’re glad to share with you some of the most interesting third-party visualizations we’ve recently come across. Here’s what DataViz Weekly has for you to check out this time — look at these cool graphics:
- Future of jobs in the regions of Europe — McKinsey Global Institute, Google, et al.
- Flood risk factor database for the United States — First Street Foundation, et al.
- Changes in new cases against testing — Axios
- All we know about SARS-CoV-2 — Scientific American
- Categories: Data Visualization Weekly
- 1 Comment »
Readership, NBA, Color, and Christmas Data Visualizations — DataViz Weekly
December 27th, 2019 by AnyChart Team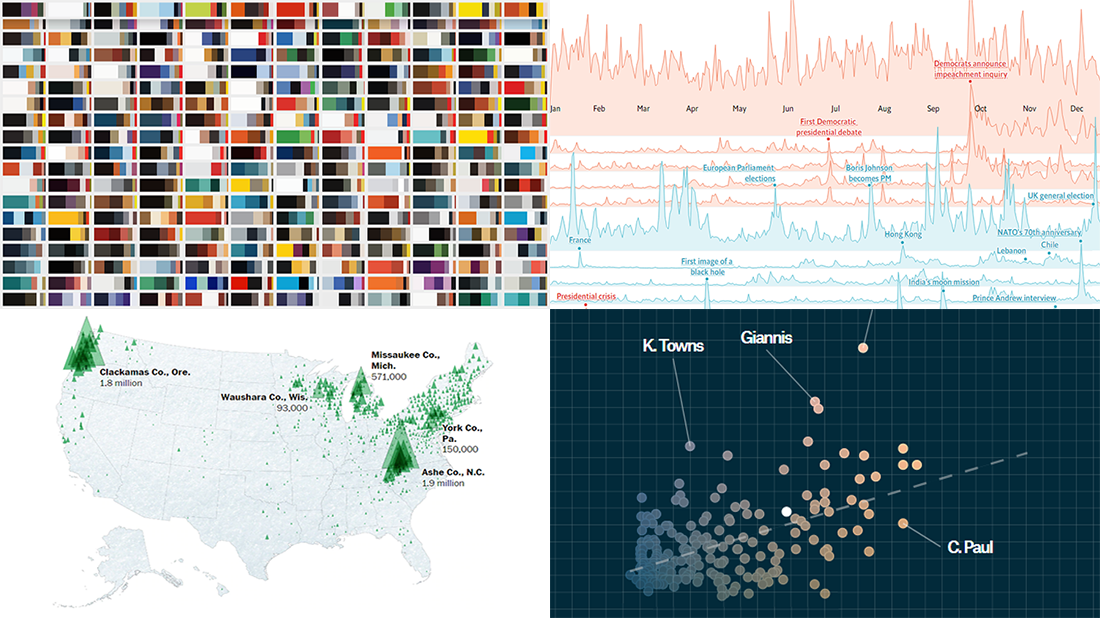 Merry Christmas to all who celebrate it! On the last Friday of 2019, we invite you to check out the year’s last DataViz Weekly article on AnyChart Blog, highlighting some of the most interesting charts published at the end of the year. Of course, we could not help featuring some Christmas data graphics in this festive week. But here you will also learn about projects with cool charts on other subjects. Here’s a list of what the data visualizations shown in today’s DataViz Weekly are about:
- Where American Christmas trees come from — The Washington Post
- Top news stories of 2019 by readership — The Economist
- NBA players’ performance against pay — The Pudding
- Colors on Scientific American’s covers over 175 years of the magazine’s life — Scientific American
- Categories: Data Visualization Weekly
- No Comments »
Tesla Sales, Brexit Vote, Birth Costs, Health Disparities — DataViz Weekly
January 25th, 2019 by AnyChart Team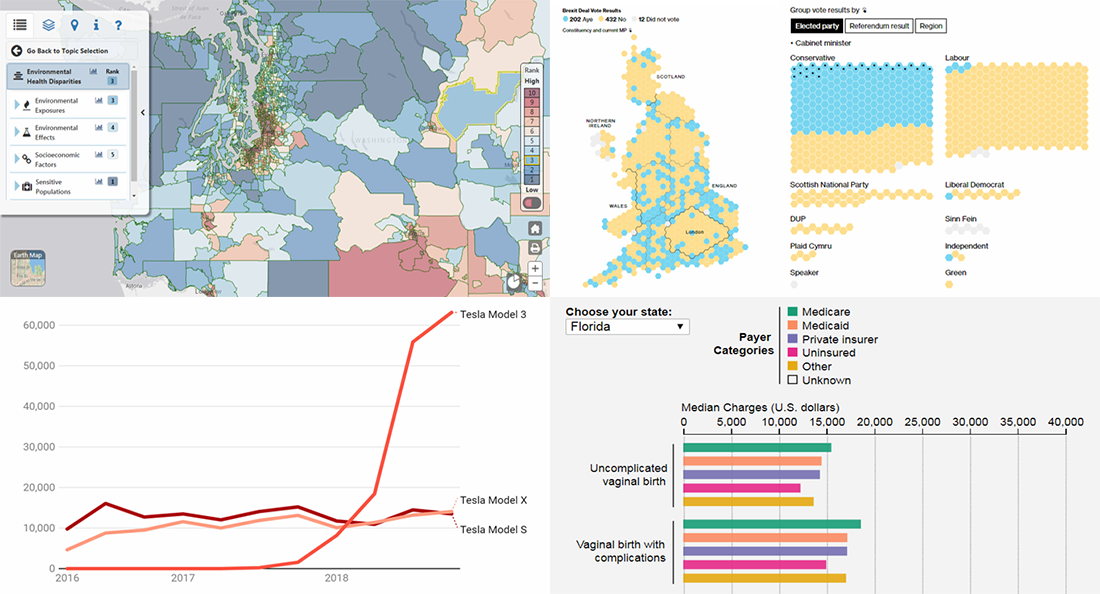 In the new DataViz Weekly post, we highlight interesting interactive data visualizations that have come to our attention this week. Take a look at charts showing details about Tesla sales, Brexit vote in the British Parliament, birth charges in American hospitals, and environmental health disparities in the Washington state.
- Categories: Data Visualization Weekly
- No Comments »