Qlik Sense Visualization Extensions AnyChart, AnyStock and AnyGantt Updated with New Features
July 16th, 2020 by AnyChart Team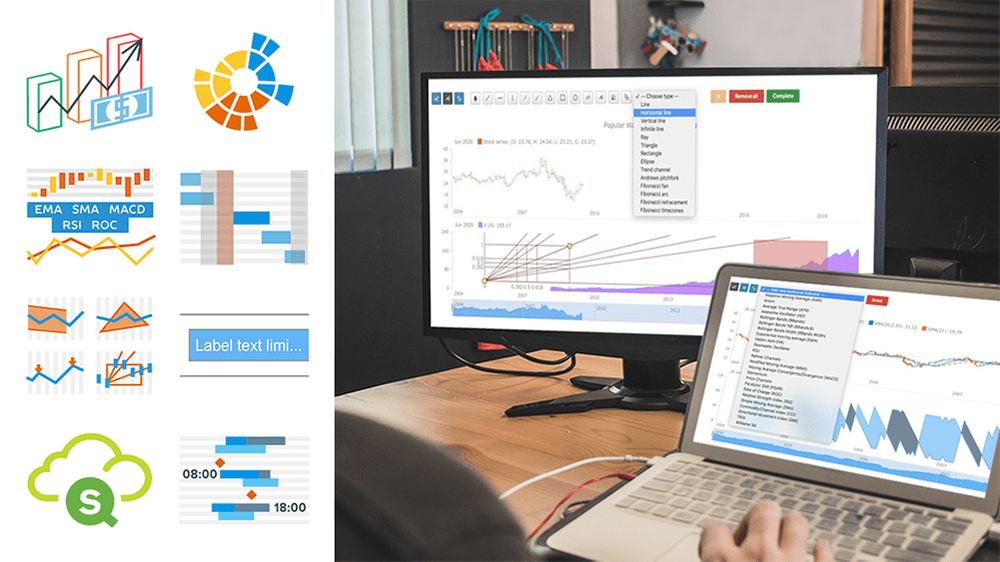 A number of new powerful capabilities are now available in our extensions for Qlik Sense! The new features are designed to help speed up data analysis in the native Qlik environment, making it even more intuitive and workflows streamlined.
Read more at qlik.anychart.com »
- Categories: AnyChart Charting Component, AnyGantt, AnyStock, Big Data, Business Intelligence, Financial Charts, Gantt Chart, News, Qlik, Stock Charts
- No Comments »
New Helpful Features in AnyGantt Project Management Bundle for Qlik Sense
June 16th, 2020 by AnyChart Team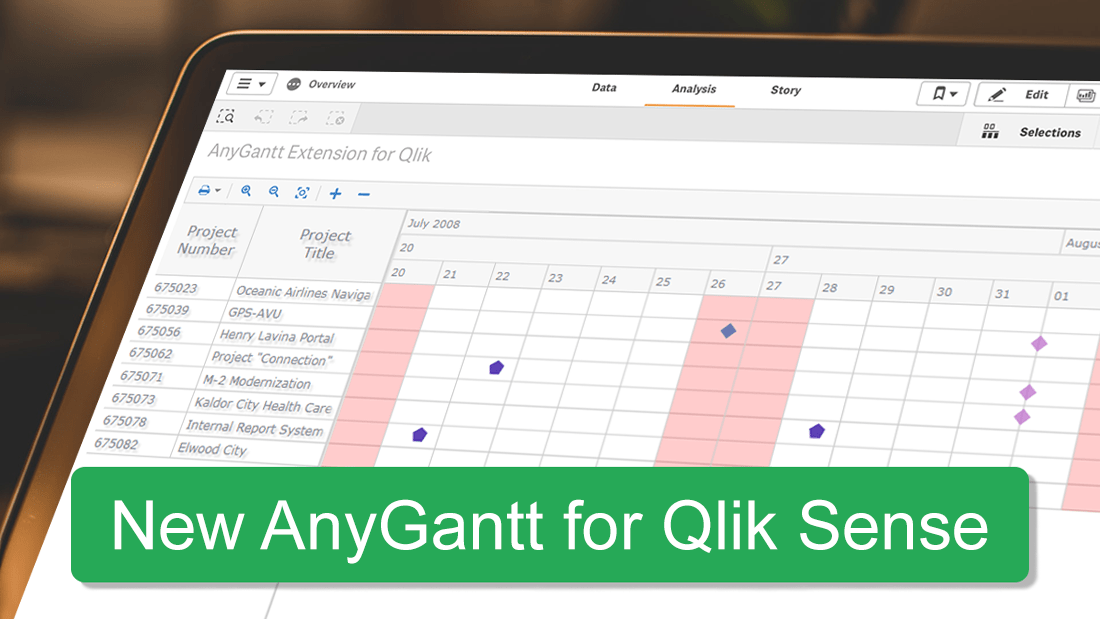 Just added, two new helpful features for our project management bundle for Qlik Sense! Enjoy a more precise control over the visualization of your data and make better decisions!
Read more at qlik.anychart.com »
- Categories: AnyChart Charting Component, AnyGantt, Big Data, Business Intelligence, Gantt Chart, News, Qlik
- No Comments »
Qlik Sense Timeline Chart and More New Features in AnyGantt Extension V 4.1.244
April 24th, 2020 by AnyChart Team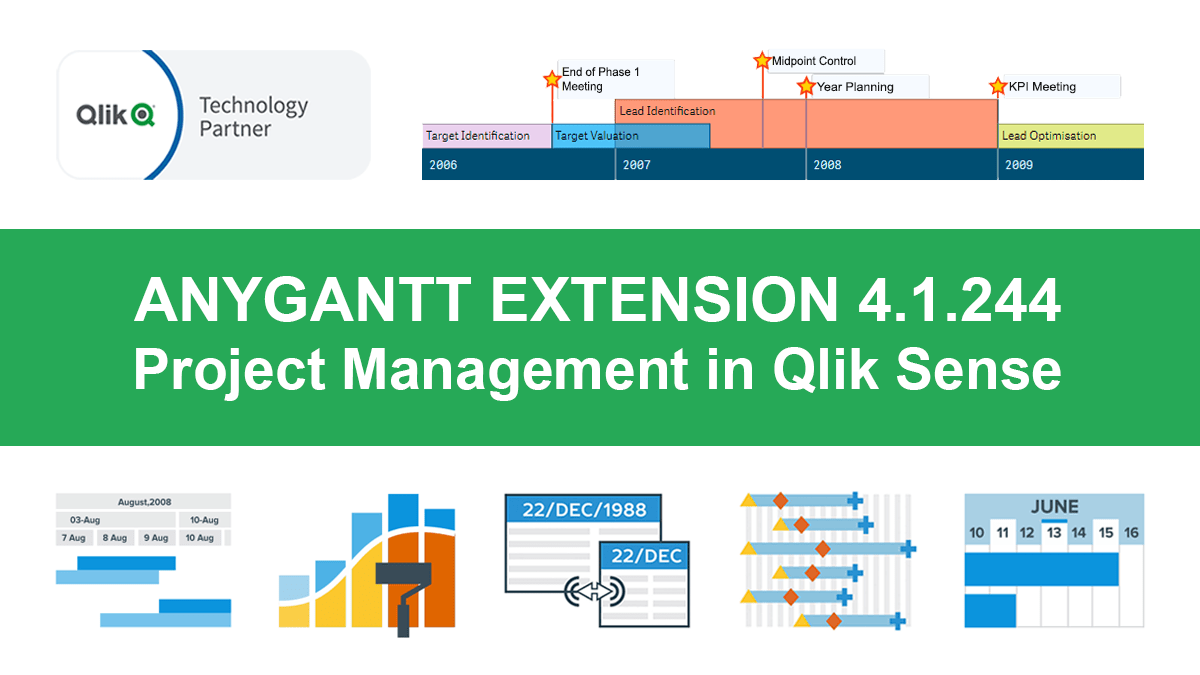 Hey Qlikkies, meet the awesome Qlik Sense Timeline Chart from AnyChart! We are excited to deliver it in the new, just-released version of our AnyGantt extension.
Hence the Timeline Chart has become — wait for it — the 40th chart type available in our data visualization extensions for Qlik Sense overall! For AnyGantt specifically it is the 3rd one, making AnyGantt a unique, cutting-edge Project Management Bundle for Qlik now comprising the Project Gantt Chart, Resource Chart, and Timeline Chart in a single intuitive extension.
However, it is not all great news. Release 4.1.244 also brings a bunch of other awesome features and improvements to the AnyGantt extension.
Read more at qlik.anychart.com »
- Categories: AnyChart Charting Component, AnyGantt, Big Data, Business Intelligence, Gantt Chart, News, Qlik
- No Comments »
AnyChart JS Charts 8.7.1 Is Ready for Download — Enjoy New Version!
January 28th, 2020 by AnyChart Team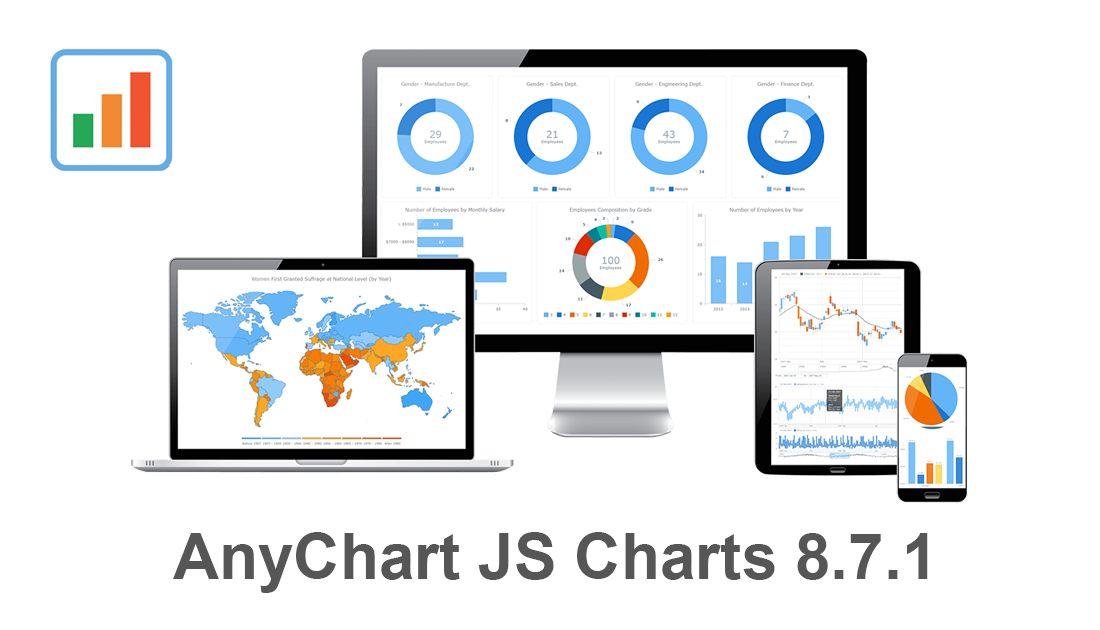 Our JavaScript charting libraries are now updated! Just before the new year, we delivered important fixes and improvements to them in version 8.7.1. These updates make it even better to visualize data using our flexible visualization solutions for cross-platform HTML5 charting — AnyChart JS for basic charts, AnyGantt JS for project and resource charts, AnyStock JS for stock and any other time-series charts, and AnyMap JS for geographical and seat map charts.
Download version 8.7.1 now and start enjoying our updated JavaScript charting libraries!
Check the version history of the library you are using to see exactly what has been improved and fixed in the new release:
Let us know what else we should add or enhance. We’ve been always listening to you and your feedback has always largely determined our roadmap. Of course, this will remain so in the new year (and beyond). Any questions, give us a shout and we’ll be happy to assist you asap.
We wish you a happy and prosperous 2020!
- Categories: AnyChart Charting Component, AnyGantt, AnyMap, AnyStock, Big Data, Business Intelligence, Dashboards, Financial Charts, Gantt Chart, HTML5, JavaScript, News, Stock Charts
- No Comments »
Try Updated AnyGantt Extension for Qlik Sense with New Stunning Features
January 22nd, 2020 by AnyChart Team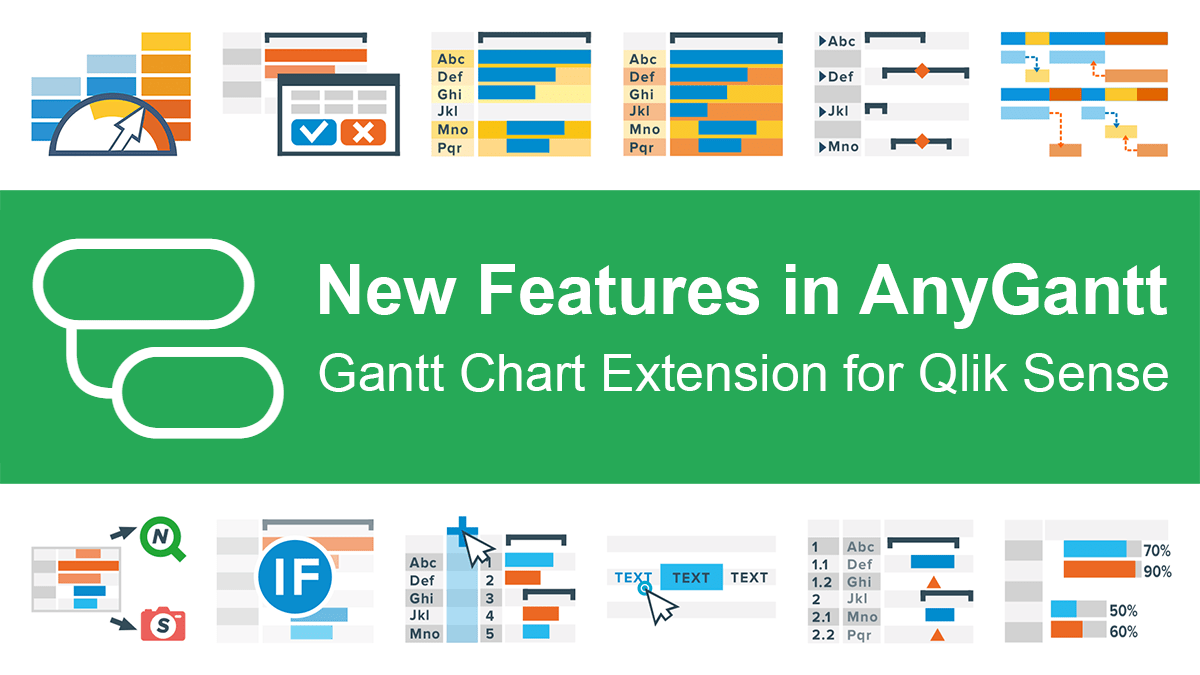 Great news for Qlikkies: We released another major update to our AnyGantt extension for Qlik Sense, which will further enhance your project data visualization experience. So the current 4th generation of our solution for Gantt charts in Qlik already delivers a whole bunch of new awesome features and improvements — learn about them now in a quick overview.
Read more at qlik.anychart.com »
- Categories: AnyChart Charting Component, AnyGantt, Big Data, Business Intelligence, Gantt Chart, News, Qlik
- No Comments »
Readership, NBA, Color, and Christmas Data Visualizations — DataViz Weekly
December 27th, 2019 by AnyChart Team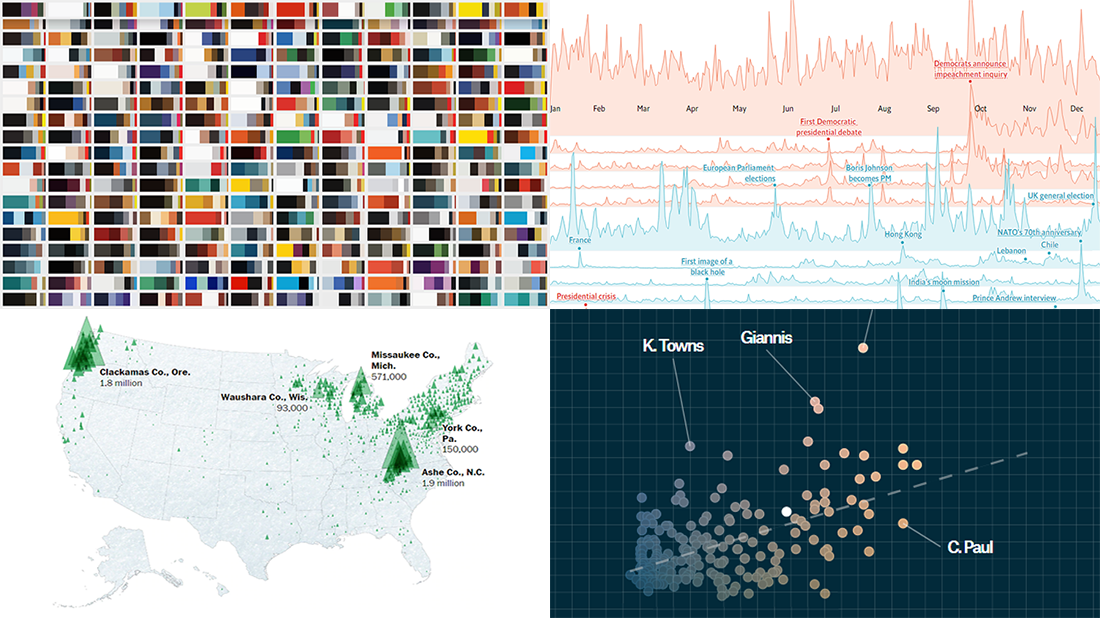 Merry Christmas to all who celebrate it! On the last Friday of 2019, we invite you to check out the year’s last DataViz Weekly article on AnyChart Blog, highlighting some of the most interesting charts published at the end of the year. Of course, we could not help featuring some Christmas data graphics in this festive week. But here you will also learn about projects with cool charts on other subjects. Here’s a list of what the data visualizations shown in today’s DataViz Weekly are about:
- Where American Christmas trees come from — The Washington Post
- Top news stories of 2019 by readership — The Economist
- NBA players’ performance against pay — The Pudding
- Colors on Scientific American’s covers over 175 years of the magazine’s life — Scientific American
- Categories: Data Visualization Weekly
- No Comments »
AnyChart Recognized in Top 10 Business Intelligence and Analytics Companies of 2019
November 19th, 2019 by AnyChart Team We are excited to announce that Analytics Insight, a magazine that covers big data and business intelligence developments, included AnyChart in The 10 Next Generation BI and Analytics Companies of 2019 — “for providing the most advanced solutions and playing a significant role in shaping the future of these disruptive technologies.”
The list has been made public in the just-released November issue of the magazine and is accompanied by the stories about each featured company. With permission of Analytics Insight, today we are republishing the magazine’s story about us on our blog — “AnyChart: Turning Data into Actionable Insights with Award-Winning Data Visualization Solutions.”
Read the story of AnyChart as it appeared on Analytics Insight »
- Categories: AnyChart Charting Component, AnyGantt, AnyMap, AnyStock, Big Data, Business Intelligence, Charts and Art, Dashboards, Financial Charts, Flash Platform, Gantt Chart, GraphicsJS, HTML5, Interesting Facts, JavaScript, News, Success Stories
- No Comments »
Qlik Sense Gantt Chart Extension AnyGantt Gets New Awesome Features in Version 4.0
November 1st, 2019 by AnyChart Team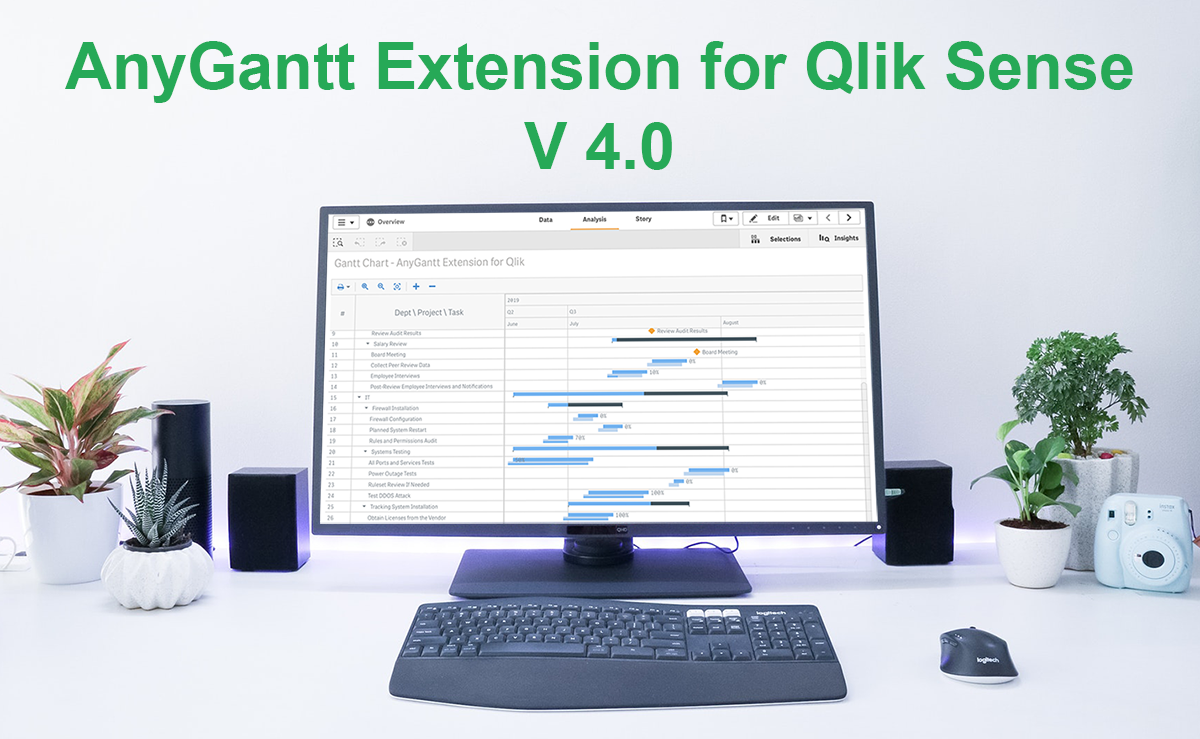 Good news, Qlikkies! We’ve released a major update to our Qlik Sense Gantt chart extension AnyGantt, bringing a bunch of new awesome features to further improve your project and resource data visualization experience using it. Look what’s new in version 4.0!
Read more at qlik.anychart.com »
- Categories: AnyChart Charting Component, AnyGantt, News, Qlik
- No Comments »
Devon County Council Uses AnyChart JS Charts for Health Data Visualization
August 29th, 2019 by AnyChart Team As a globally leading, award-winning data visualization solution, our JavaScript charting library is used not only in commercial apps but also by governments of all levels worldwide. Devon County Council, a UK local authority administering the English county of Devon, is one such customer.
In particular, Mark Painter from Devon County Council’s Community and Public Health Intelligence Team told us they use AnyChart to generate all the charts in their Health and Wellbeing Profiles. We’ve interviewed him to learn more. (Stack: WordPress/CSV.)
- Categories: AnyChart Charting Component, Success Stories
- No Comments »
AnyChart CEO Anton Baranchuk Named One of Most Promising CEOs of 2019
August 13th, 2019 by AnyChart Team Insights Success magazine has named Anton Baranchuk, CEO and Co-founder of AnyChart, one of The Most Promising CEOs of 2019. Celebrating this exciting recognition, we are pleased to share with you a special article about him and our company. Published in the latest issue of Insights Success, the story is based on Anton’s recent interview with the magazine. Take a read.
- Categories: AnyChart Charting Component, News, Success Stories
- No Comments »