Heat Maps, Scrolling, Live Gantt Charts – 7.8.0 Release
November 4th, 2015 by Margaret SkomorokhGood News! We have updated all our products, and now AnyChart, AnyGantt, AnyStock, and AnyMap 7.8.0 are available for download. We have added a number of important features, including JavaScript Heat Map charts and Zoom & Scroll in AnyChart as well as Editing Mode and UI in AnyGantt (see Gantt Interactivity and Gantt Live Edit API and UI).
AnyChart 7.8.0 New Features
 |
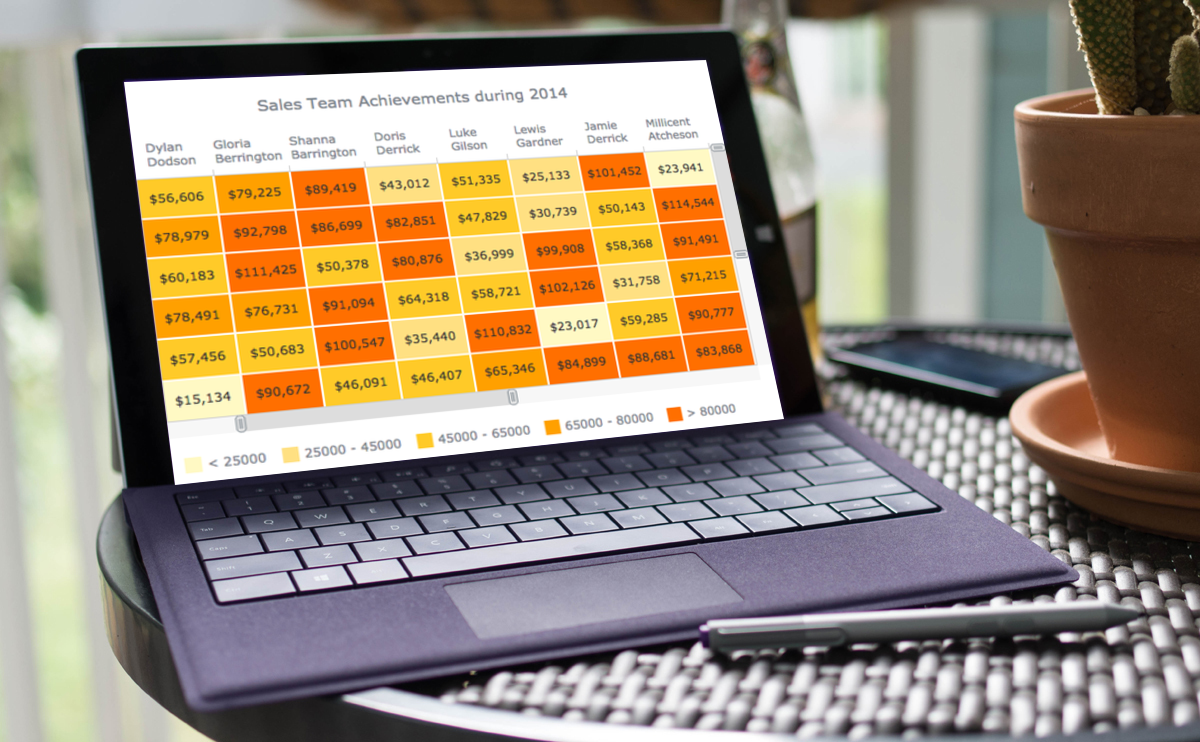
Heat Map Chart A Heat Map chart is a graphical representation of data where the individual values contained in a matrix are represented as colors. Take a look at Heat Maps in the Gallery >> Learn more about Heat Maps >> |
 |
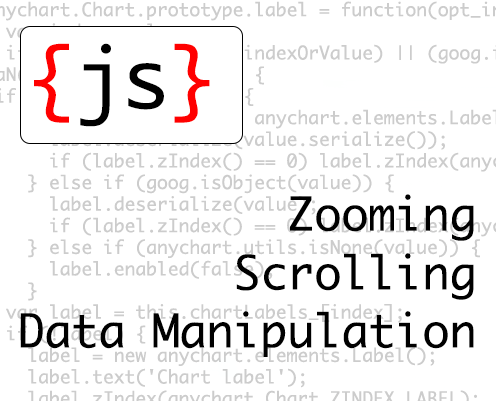
Zoom and Scroll (All Basic Chart Types) The Scroller feature works with all basic chart types. It allows users to zoom and scroll. Take a look at the Gallery Sample >> Learn more about the Scroller Feature >> |
- Categories: AnyChart Charting Component, AnyGantt, AnyMap, AnyStock, News
- No Comments »
7.7.0 Release
October 1st, 2015 by Margaret SkomorokhA lot of good things come in this grand package: AnyStock HTML5 release, 200+ Map Collection and Bubble Series for AnyMap, and new types of Tooltips along with the ability to multi-select points in AnyChart.
AnyStock 7.7.0 Features
AnyChart Stock and Financial Charts (AnyStock) is a JavaScript-based financial charting solution. AnyStock technology turns your real-time data into highly sophisticated interactive web charts. Designed to display date- and time-based information, AnyStock is an ideal tool for client reporting and performance reporting applications, bringing the analysis of your financial data to life.
 |
Stock Data Engine We are proud to introduce anychart.data.Table, a data layer designed specifically to meet Stock and Financial Charts needs. Beside basic features like data streaming, data mapping, and transaction-based data flow, anychart.data.Table provides the ability to search and select data by DateTime intervals, which allows to implement custom UI elements based on this data. Learn more about Stock Data Engine >> Take a look at the Gallery sample >> |
 |
Ultimate Performance Good rendering performance is essential for Stock and Financial Charts, and AnyStock meets this requirement in full. Our performance tests show the ability to render 300,000 points in less than a second on an average PC. The data stream can append 10,000 data points in 100 milliseconds. You can test it yourself on the performance test page. Take a look at the Speed Test page >> |
This release of AnyStock includes basic chart and plot layout options and basic features (such as Scroller, Legend, and Value Highlighter), along with the Column, Line, and OHLC series types. If you are wondering where the technical indicators, other series types, event markers and drawings are, the answer is simple: in our roadmap! Check it out and see that we will catch up very fast. See the roadmap>>
AnyMap 7.7.0 New Features
 |
Map Collection Without geographical data, it is impossible to create a data visualization related to geographic areas. We are happy to introduce our new Map Collection. For the moment it contains 200+ country maps and one world map. We are planning to extend this collection, and, of course, the ability to create custom maps is available. See Map Collection CDN Page >> Take a look at the Map Collection in AnyChart Playground >> |
 |
Bubble/Proportion Maps Bubble maps (also known as Proportion maps) are usually used to display or compare quantitative data related to geographic areas, be it election results, sales statistics per region, or earthquake magnitude. Take a look at the Map Gallery sample >> Learn more about Bubble/Proportion maps >> |
- Categories: AnyChart Charting Component, AnyGantt, AnyMap, AnyStock, Gantt Chart, HTML5, JavaScript, News
- No Comments »
AnyChart, AnyMap, and AnyGantt 7.6.0
August 13th, 2015 by Margaret Skomorokh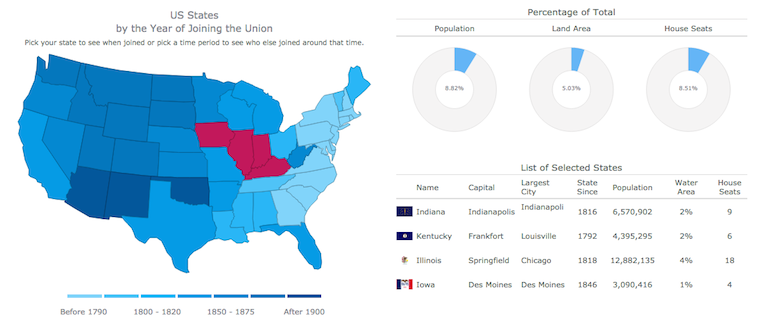
We are proud to announce 3 new releases – AnyChart 7.6.0, AnyMap 7.6.0, AnyGantt 7.6.0. Our team has been working hard to make our products even more aesthetically pleasing, and now all AnyChart charts have a new modern look and design (See the New Look and Theming feature). We have also added a number of other great improvements, and here are the most important of them:
AnyChart 7.6.0 New Features
 |
All AnyChart products now support the Theming feature which makes customizing and integrating charts easier. With Theming, you can set similar visual and functional settings for all charts without duplicating your code. Take a look at Gallery samples >> Learn more about Theming >> |
 |
Crosshairs are thin vertical and horizontal lines centered on a data point, which are useful when you want to locate a point precisely on your chart or to analyse data by comparing different charts. Take a look at a Gallery sample >> Learn more about Crosshair >> |
 |
Pie/Donut Charts are popular, nice-looking, and very easy to understand, and now you can make them even more attractive by adding 3D! Take a look at Gallery samples >> Learn more about 3D Pie Chart >> |
AnyMap 7.6.0 Features
- Choropleth Maps provide an easy way to visualize how a measurement varies across a geographic area.
- Ordinal Color Range looks like several boxes of different colors which depend on the palette chosen according to the type of a map and its data.
- Quantitative Color Range is a bar colored with a gradient, its colors depend on the palette of a map and its data.
- Full Compatibility with other Charts – when you need to show any extra information along with a map – no problem! Use AnyMap with any other charts.
AnyGantt 7.6.0 New Features
- Now a double-click on borders of data grid columns resets their width to the default value.
- Added the ability to draw the Baseline above the Actual, see API Reference for details.
- AnyGantt now supports formatting for Data Grid Columns, see API Reference for details.
AnyChart version history: https://www.anychart.com/products/anychart/history/
AnyMap version history: https://www.anychart.com/products/anymap/history/
AnyGantt version history: https://www.anychart.com/products/anygantt/history/
Trial download: https://www.anychart.com/download/
P.S. The set of ready-to-use maps is rather small for the moment, but we will add about a hundred maps in a week, and then the list will just keep growing.
- Categories: AnyChart Charting Component, AnyGantt, AnyMap, HTML5, JavaScript, News
- No Comments »
AnyChart 7.5.0 and AnyGantt 7.5.0 Released – new version of our HTML5 charts
June 18th, 2015 by Margaret SkomorokhGood news! Today we have two major releases of our HTML5 charts for our customers: AnyChart 7.5.0 and AnyGantt 7.5.0. In the new versions of our components, you will find the Funnel and Pyramid chart types, Dashbording Tools, the Printing and Animation options, and other significant improvements. Check them out:
AnyChart 7.5.0 New Features
 |
Dashboarding Tools The purpose of Dashboarding Tools is to provide simple and convenient instruments for building complex Dashboards. In the current release we present the first part of this set: the ability to highlight/hide series and points, using special methods. See API Reference for more details >> |
 |
Printing The new printing method allows you to make a full-page print of a chart or a dashboard. It supports eight paper size formats: US Letter, A0 – A6, and the portrait/landscape switch. Read more about Printing >> |
 |
Animation Most popular charts types – Line, Column, Bar, Area, and so on – are now animated. Animation supports duration settings and start&finish events. Take a look at the Gallery samples >> |
 |
Funnel Charts Funnel charts (also called accumulation charts) show percentage ratio. They are often used to represent different stages in sales process and show the amount of potential revenue for each stage. Read more about Funnel Charts >> Take a look at the Gallery samples >> |
 |
Pyramid Charts Pyramid charts are used to visualize the hierarchical structure of topics, and progressively ordered quantitative data. Read more about Pyramid Charts >> Take a look at the Gallery samples >> |
AnyGantt 7.5.0 New Features
 |
Printing The new printing method allows you to make a full-page print of your chart. It supports eight paper size formats: US Letter, A0 – A6, and the portrait/landscape switch. Read more about Printing >> |
 |
Events Events allow to handle such user actions as rowClick, rowMouseOver, rowMouseMove, etc. with the .listen() and .listenOnce() methods. Using this methods, you can override default chart interactivity. |
 |
XML/JSON/CSV Data Support The XML and JSON formats can be used for data and settings input; CSV can be used for data input. XML and JSON schemas are available. Learn how you can work with data >> |
 |
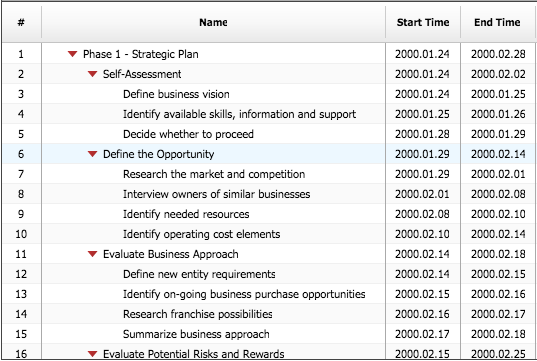
Summary Tasks Auto-Calculation The actualStart, actualEnd, and progressValue data fields of grouping tasks became optional. If they are missing, auto-calculation is done, based on tasks in the group. Take a look at the Gallery sample >> |
AnyChart version history: https://www.anychart.com/products/anychart/history/
AnyGantt version history: https://www.anychart.com/products/anygantt/history/
Trial download: https://www.anychart.com/download/
- Categories: AnyChart Charting Component, AnyGantt, Dashboards, Gantt Chart, HTML5, JavaScript, News
- No Comments »
AnyGantt 7.4.0 Released
March 30th, 2015 by Margaret SkomorokhWe are glad to announce that AnyGantt 7.4.0 is released. Our Gantt component is based on JavaScript (HTML5) and is easy to integrate with AnyChart. In this version, we have made a few useful improvements:
 |
Tooltip feature for all Timeline Elements Tooltips can be added to all timeline elements (such as resources, tasks, and periods). The appearance and format of Tooltips can be customized as always. Take a look at a Gallery sample >> |
 |
Possibility to Hover/Select Gantt Chart Rows Gantt charts are now more interactive and responsive in use. You can adjust both the appearance of the selection and the special settings for the selected elements (such as resources, tasks, and periods). Take a look at Gallery sample >> |
 |
Gantt Chart Toolbar Panel Just a few lines of code now allow you to create an UI-panel that helps to Print, Export to pictures, Zoom In/Out, Expand or Collapse. Take a look at Gallery sample >> |
 |
Horizontal Scroll in DataGrid A DataGrid now can be horizontally scrolled. Have a look at this feature through the link below. Take a look at Gallery sample >> |
AnyGantt version history: https://www.anychart.com/products/anygantt/history/
Trial download: https://www.anychart.com/download/
- Categories: AnyGantt
- No Comments »
AnyChart and AnyGantt 7.3.1 Update
January 22nd, 2015 by Margaret Skomorokh
Today we are releasing a small bug fix update to AnyChart and an improvement update to AnyGantt.
AnyChart 7.3.1: bug fixes
- Problems with updating data points on Pie Charts.
- Problems with updating legend items and appending series in Scatter/Cartesian/Radar/Polar Charts.
AnyGantt 7.3.1: new features
- The Tooltips feature for Resource and Project Charts.
- Data grid and timeline rows highlighting.
- Improvements of scrollbar style.
AnyChart version history: https://www.anychart.com/products/anychart/history/
AnyGantt version history: https://www.anychart.com/products/anygantt/history/
Trial download: https://www.anychart.com/download/
- Categories: AnyChart Charting Component, AnyGantt
- No Comments »
AnyGantt HTML5 Beta Version Available
December 17th, 2014 by Margaret SkomorokhToday we present you a beta version of AnyGantt – now JavaScript (HTML5). Note that the new AnyGantt is much better integrated with AnyChart (and vice versa): all charts or their components can be combined and used together.

Though it is just a beta, all key features are already available:
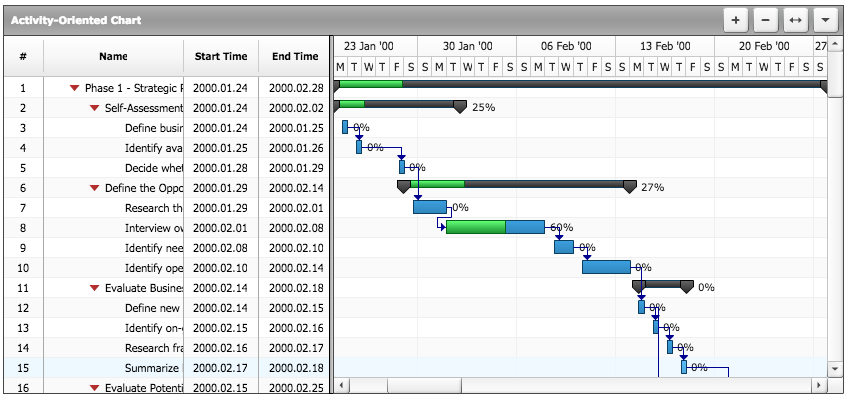 |
Project Gantt Chart Intended for showing progress of completion of a single task or a group of tasks, taking into consideration their planned time periods and actual ones. Read more about the Project Gantt Chart >> Take a look at a Gallery sample >> |
 |
Resource Gantt Chart Intended for showing the resources you have and spreading these resources along the timeline (into periods). Read more about the Resource Gantt Chart >> Take a look at Gallery sample >> |
 |
Rich JavaScript API All AnyGantt settings can be changed dynamically at any moment. See JavaScript API >> |
 |
Data Grid as a Standalone Feature In AnyChart 7.x versions, all visual elements can be used as standalone features, and Data Grid is not an exception. Take a look at a Gallery sample >> |
AnyGantt version history: http://6.anychart.com/products/anygantt7/history/
Trial download: https://www.anychart.com/download/
- Categories: AnyGantt
- No Comments »
AnyGantt 4.2.0 Available
November 15th, 2011 by Margaret SkomorokhOur component for building Gantt charts has been updated. The new version – AnyGantt 4.2.0 – contains the following changes:
- AnyGantt JS integration library has been refactored:
— AnyChart.js is now named AnyGantt.js;
— AnyChart class is now called AnyGantt.Please note, that you have to change these names in your JS code when upgrading.
- A Flex version of AnyGantt component. Read more at Working with Gantt Chart in FLEX.
- Expand and collapse tasks using JavaScript.
- Scroll and Zoom using JavaScript.
- dateTimeRangeChange, verticalPositionChange and expandCollapse events to handle changes in data plot.
- Printing fixes.
Version history: http://6.anychart.com/products/anygantt7/history/
Trial download: https://www.anychart.com/download/
Download for registered customers: https://www.anychart.com/customer_area/
- Categories: AnyGantt
- No Comments »
Eugeniy Stern Recommends AnyGantt to His Clients
April 11th, 2011 by Margaret SkomorokhWe are happy to publish a new success story, this time about Eugeniy Stern – an independent SAP development consultant, who has been working in this field since 1997, assisting large enterprises in oil-producing, oil-refining and transport industries. In some of his projects, he used AnyGantt.
The SAP NetWeaver technology platform enables the composition, provisioning, and management of SAP as well as non-SAP enterprise software applications. There is a built-in solution for creating Gantt charts, but it was found lacking visual appeal needed for business reporting.
After a market research, it appeared that AnyGantt fits best of all the charting components. AnyGantt was recommended to the clients, and during this year, a few projects using AnyGantt in SAP NetWeaver will be launched.
The story can be found here: Eugeniy Stern Recommends AnyGantt to His Clients >>
Other stories: https://www.anychart.com/company/success_stories.php
- Categories: AnyGantt, Success Stories
- No Comments »
Knowledgebase Updates
February 16th, 2011 by Margaret SkomorokhDon’t forget that we have a knowledgebase: https://www.anychart.com/kb
We have already written about it before: https://www.anychart.com/blog/2009/06/30/anychart-knowledge-base
We do our best to update it as and when necessary and recently have added a few articles:
AnyChart
- How to display all axis labels?
- Is it possible to refresh chart every X seconds?
- How to insert point custom attributes when data is in JSON format?
AnyGantt
We want to note that this problem: Documentation doesn’t display properly in Internet Explorer 7 and later has lost relevance in AnyChart 5.1.2.5
P.S. We are very pleased that our customers often find a minute to thank us and we have eventually added a testimonials page: https://www.anychart.com/company/testimonials.php
Thanks to everybody who has spoken out or not.
- Categories: AnyChart Charting Component, AnyGantt
- No Comments »