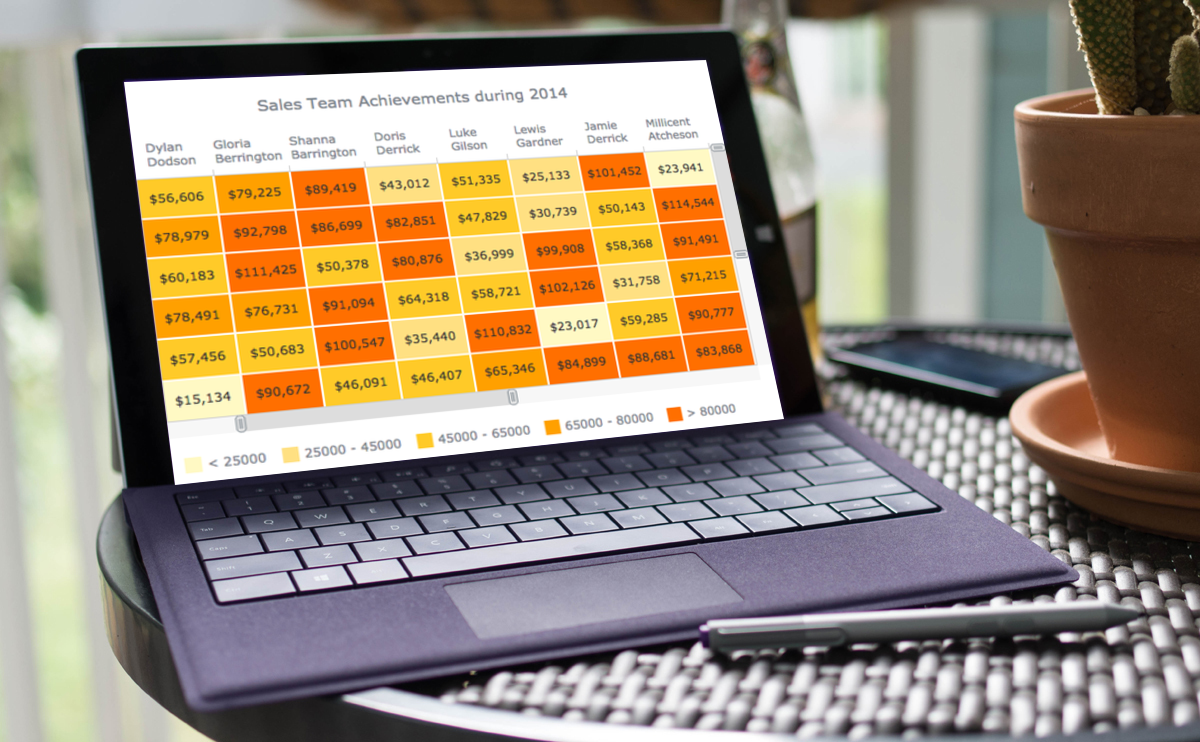
Good News! We have updated all our products, and now AnyChart, AnyGantt, AnyStock, and AnyMap 7.8.0 are available for download. We have added a number of important features, including JavaScript Heat Map charts and Zoom & Scroll in AnyChart as well as Editing Mode and UI in AnyGantt (see Gantt Interactivity and Gantt Live Edit API and UI).

AnyChart 7.8.0 New Features
 |
Heat Map Chart A Heat Map chart is a graphical representation of data where the individual values contained in a matrix are represented as colors. Take a look at Heat Maps in the Gallery >> Learn more about Heat Maps >> |
 |
Zoom and Scroll (All Basic Chart Types) The Scroller feature works with all basic chart types. It allows users to zoom and scroll. Take a look at the Gallery Sample >> Learn more about the Scroller Feature >> |
AnyChart and AnyMap 7.8.0 New Features
- New text formatting helper functions added: String, Date/Time, and Number.
- Event objects in point listeners: structure improved, now easier to use.
- The defaultSeriesType, id, addSeries, removeAllSeries, getSeries, getSeriesAt, removeSeries, removeSeriesAt, and getSeriesCount methods added to make series management easier.
AnyGantt 7.8.0 New Features
- AnyGantt Editing Mode and UI Feature Added – AnyGantt 7.8.0 can now be used to create totally interactive web Gantt chart editors and scheduling systems.
Check out AnyGantt – Live Editing Section in AnyGantt Gantt Chart Samples Gallery
Read more about Gantt Interactivity, Gantt Live Edit API and UI. - New text formatting helper functions added: String, Date/Time, and Number.
AnyStock 7.8.0 New Features
- New text formatting helper functions added: String, Date/Time, and Number.
- Event objects in point listeners: structure improved, now easier to use.
- AnyStock can now accept data in an object-based format.
- The defaultSeriesType, id, addSeries, removeAllSeries, getSeries, getSeriesAt, removeSeries, removeSeriesAt, and getSeriesCount methods added to make series management easier.
AnyChart version history: https://www.anychart.com/products/anychart/history/
Trial download: https://www.anychart.com/download/
AnyGantt version history: https://www.anychart.com/products/anygantt/history/
Trial download: https://www.anychart.com/download/
AnyStock version history: https://www.anychart.com/products/anystock/history/
Trial download: https://www.anychart.com/download/
AnyMap version history: https://www.anychart.com/products/anymap/history/
Trial download: https://www.anychart.com/download/
- Categories: AnyChart Charting Component, AnyGantt, AnyMap, AnyStock, News
- No Comments »