AnyChart Triumphs Again: Awarded Best in Data Analytics and Visualization in 2024
February 19th, 2024 by AnyChart Team We are delighted to announce that AnyChart has won the prestigious 2024 DEVIES Awards in the Data Analytics & Visualization category, marking our victory for the second consecutive year!
The award celebrates our JavaScript charting library, continuously acknowledged as the world’s leading data visualization solution for developers. As AnyChart JS forms the cornerstone of our broader product line, this recognition once again highlights the technological excellence and innovation inherent in our entire suite of offerings, including the extensions for Qlik Sense.
- Categories: AnyChart charting component, AnyGantt, AnyMap, AnyStock, Big Data, Blogroll, Business Intelligence, Dashboards, Financial charts, Gantt Chart, HTML5, JavaScript, News, Oracle Apex, Qlik, Stock charts, Success stories
- No Comments »
Remembering 2023, Welcoming 2024
January 10th, 2024 by AnyChart Team Happy New Year! As the last echoes of festive celebrations fade away and we dive into the adventures of 2024, let’s bid a final farewell to 2023 by reflecting on its best moments.
For us at AnyChart, it was a remarkable year:
- Celebrated our 20th anniversary — indeed, we’ve been innovating since 2003.
- Awarded as the Best in Data Analytics & Visualization.
- Introduced more cool features and tweaks to our JavaScript charting library and other solutions.
- Launched new powerful extensions for Qlik Sense, with the Decomposition Tree taking center stage — join us in reviewing our year in the Qlik ecosystem.
- Reached some noteworthy milestones — now boasting over 80 JS charting tutorials on our blog, our Android charting library gleaming with over 2K stars on GitHub, and our social media family expanded to over 20K followers.
Looking ahead, our dedication remains unwavering: to empower your data viz and analytics journey with new and better tools. Thank you for growing with us, and cheers to your continued success, brighter and bolder in 2024!
- Categories: AnyChart charting component, AnyGantt, AnyMap, AnyStock, Big Data, Blogroll, Business Intelligence, Charts and Art, Dashboards, Financial charts, Gantt Chart, HTML5, JavaScript, News, Qlik, Stock charts
- No Comments »
Unwrapping Enhanced Interactivity for Calendar and Circle Packing Charts in AnyChart 8.12.0
December 7th, 2023 by AnyChart Team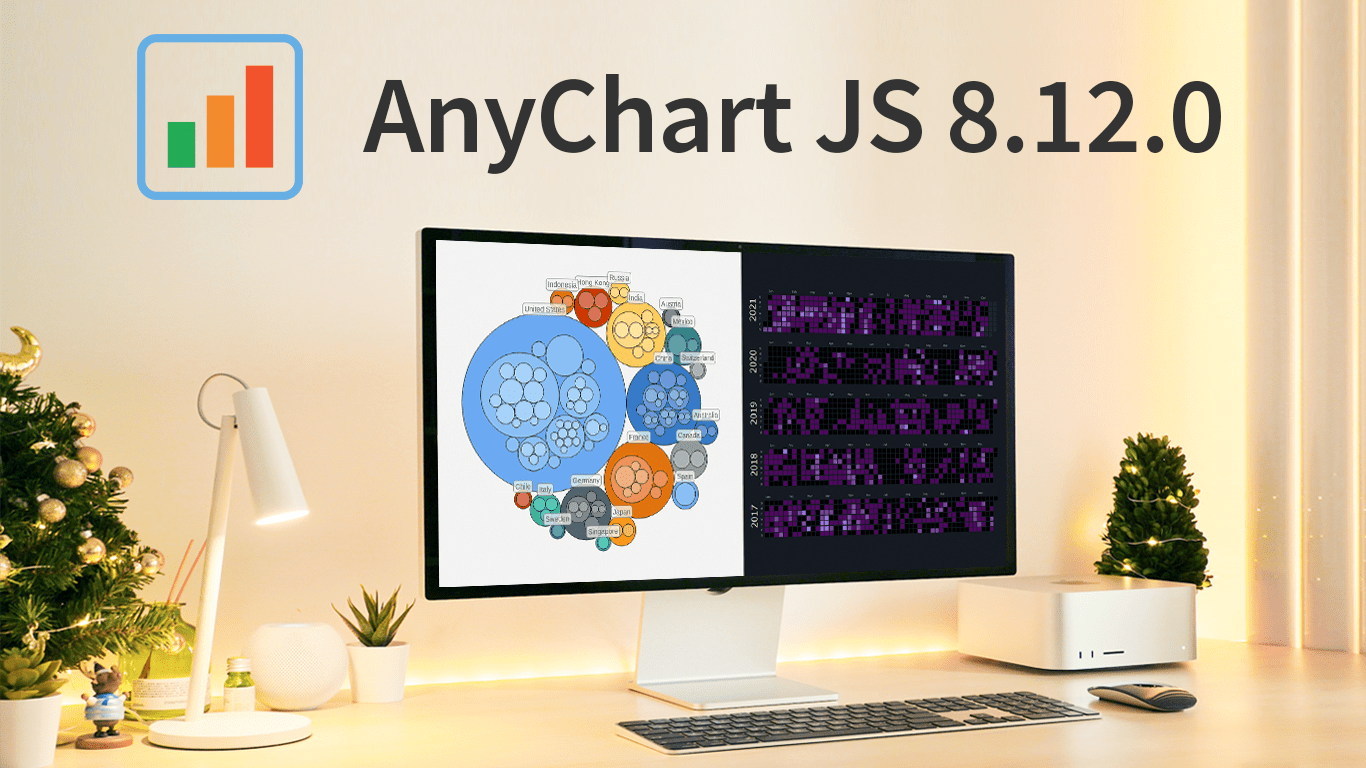 As the magic holiday season approaches, we’re thrilled to unwrap our latest gift of the year — AnyChart 8.12.0, the newest version of our powerful JavaScript charting library. Packed with various bug fixes and improvements, this release introduces a remarkable feature for Calendar and Circle Packing charts — interactivity events. Learn more about it and upgrade right now!
- Categories: AnyChart charting component, AnyGantt, AnyMap, AnyStock, Big Data, Business Intelligence, Dashboards, Financial charts, Gantt Chart, HTML5, JavaScript, News, Stock charts
- No Comments »
How to Create Resource Chart with JavaScript
October 16th, 2023 by Awan Shrestha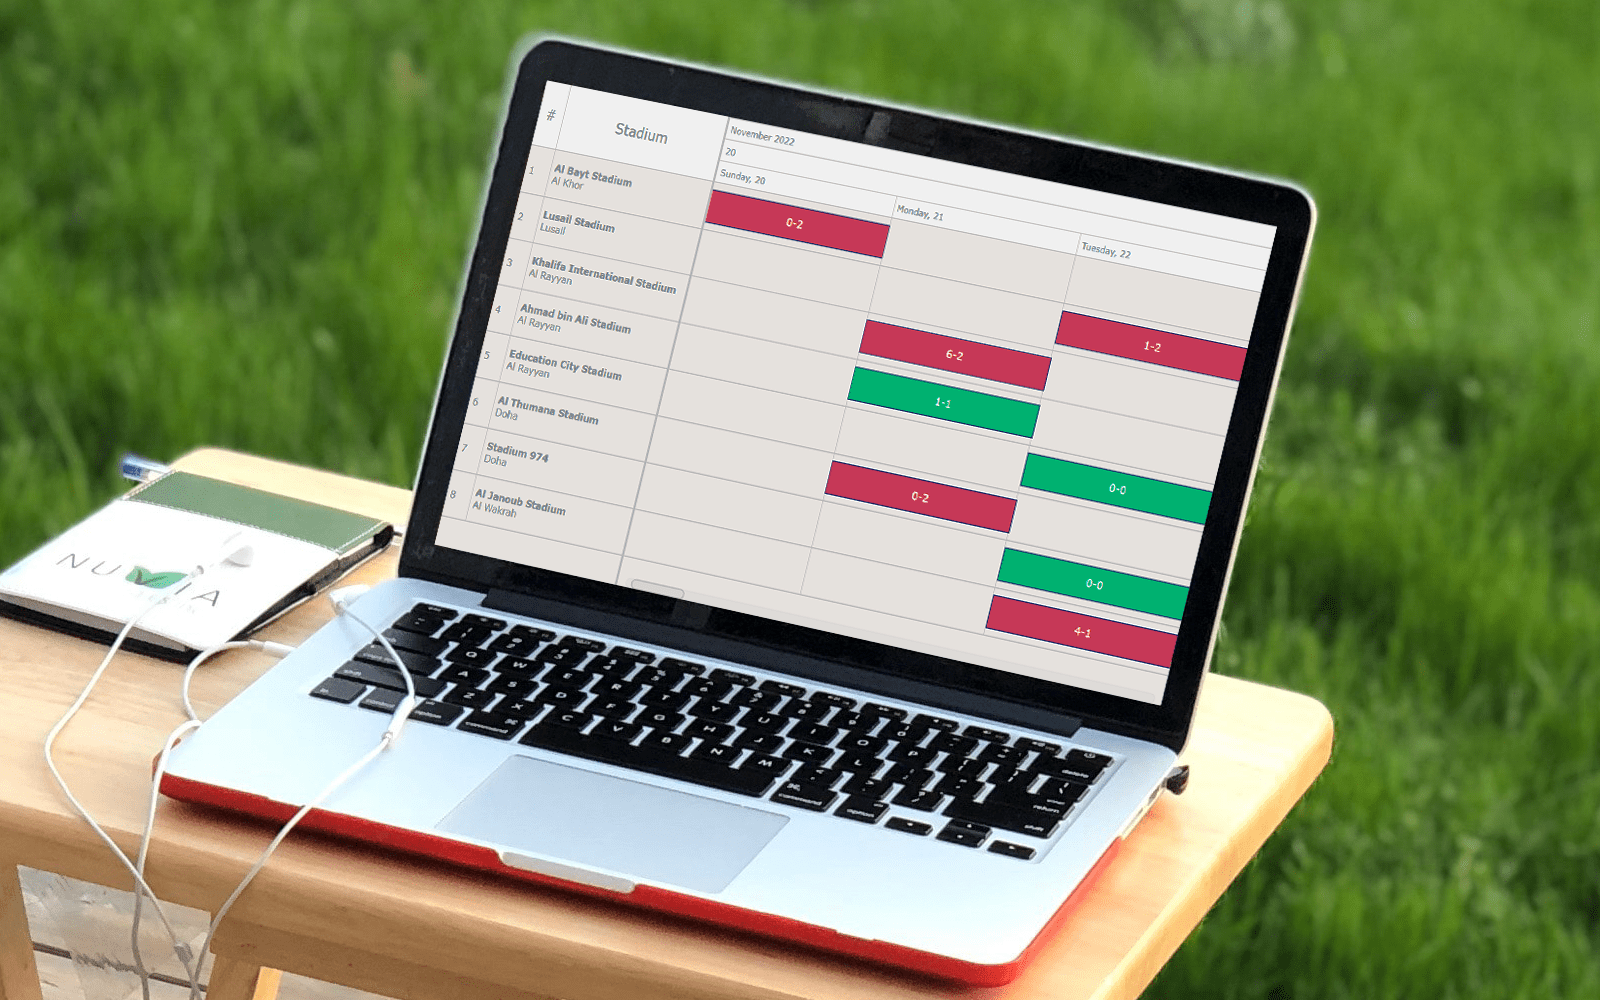 In today’s data-driven world, data visualization simplifies complex information and empowers individuals to make informed decisions. One particularly valuable chart type is the Resource Chart, which facilitates efficient resource allocation. This tutorial will be your essential guide to creating dynamic resource charts using JavaScript.
A resource chart is a type of Gantt chart that visualizes data about resource utilization, such as equipment, employees, and so on. It provides a comprehensive overview, making it easier to make informed decisions promptly. As an illustrative example, in this tutorial, I will represent the FIFA World Cup 2022 Qatar schedule by stadium, enabling you to track when and where each game took place.
Get your coding boots ready, and by the end of this guide, you’ll be well-equipped to create your own JS-based resource chart and have a valuable tool at your disposal for tracking your next favorite tournament, or servers status, or employee project assignments, or anything else of that kind.
Read the JS charting tutorial »
- Categories: AnyChart charting component, AnyGantt, Business Intelligence, Gantt Chart, HTML5, JavaScript, JavaScript chart tutorials, Tips and tricks
- No Comments »
Join AnyChart at QlikWorld Tour 2023
August 10th, 2023 by AnyChart Team Get ready to dive into an exceptional data experience at QlikWorld Tour 2023! We at AnyChart are super stoked to be part of this epic roadshow as proud sponsors and warmly invite you to join us in one of the participating U.S. cities:
- Dallas (The Star in Frisco) — August 10
- San Francisco (Oracle Park) — August 24
- New York (Pier60 at Chelsea Pier) — September 18
- Atlanta (College Football Hall of Fame) — September 20
Spoiler alert: The star of the show will be our first-ever presentation of YODA — Your Own Documents Assistant, the newest, groundbreaking, AI-driven extension for Qlik Sense. Be among the first to witness its power!
Read more at qlik.anychart.com »
- Categories: AnyChart charting component, AnyGantt, Big Data, Business Intelligence, Dashboards, Gantt Chart, News, Qlik
- No Comments »
Viva Qlik with AnyChart — Thank You QlikWorld!
May 24th, 2023 by AnyChart Team Hey, we’d like to share with you the amazing experience QlikWorld provided to its Customers and Partners alike. It was fantastic, and we’re still buzzing with excitement about all that happened in and around Mandalay Bay Las Vegas on April 17–20!
First and foremost, our Decomposition Tree extension for Qlik Sense stole the show…
Read more at qlik.anychart.com »
- Categories: AnyChart charting component, AnyGantt, Big Data, Business Intelligence, Gantt Chart, Qlik
- No Comments »
Exciting New Technical Indicators & More in AnyChart JS Charts 8.11.1
May 10th, 2023 by AnyChart Team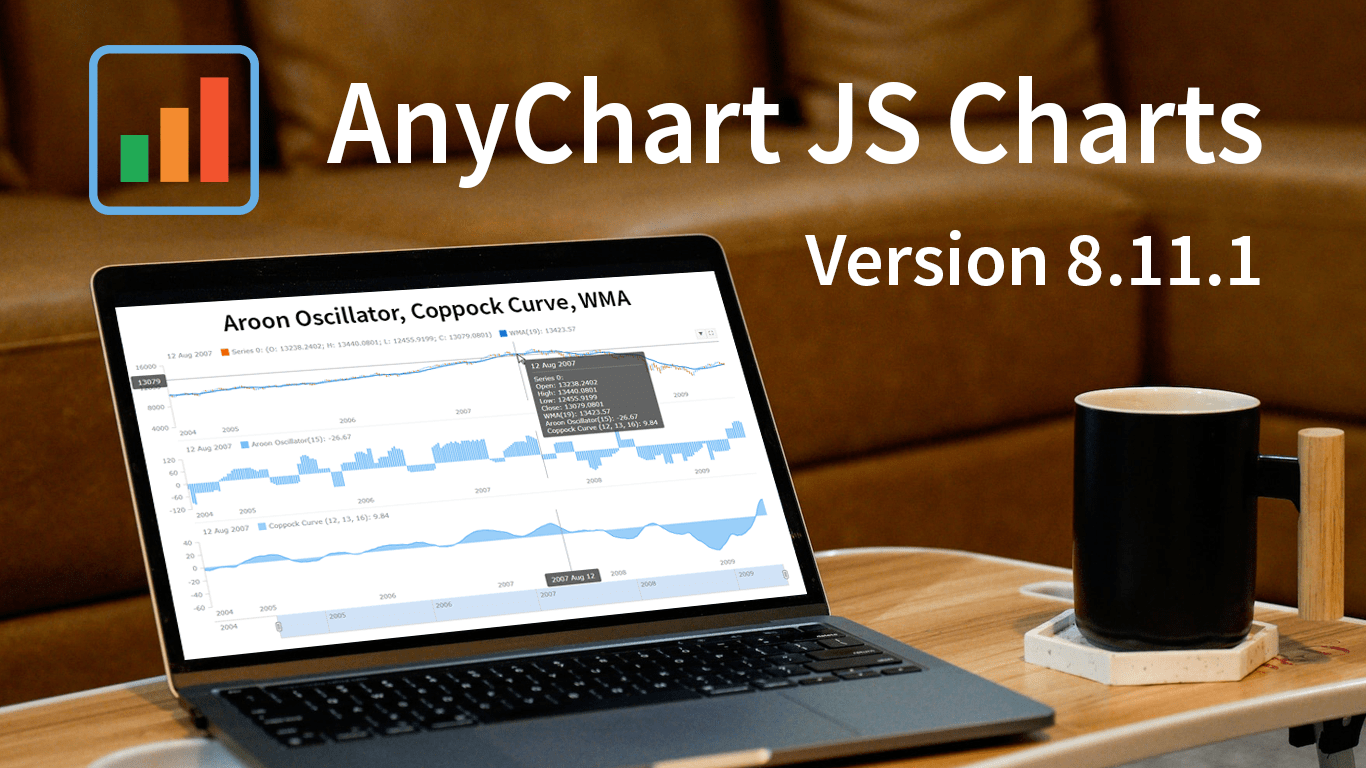 Great news! We’ve just launched version 8.11.1 of our JS charting library, and it comes with some awesome new features and improvements. Our top stars this time around are three new technical indicators that are now available straight out of the box: Aroon Oscillator, Coppock Curve, and WMA. That’s right, now in addition to the dozens of indicators already supported in our stock charts, these new options provide even more ways to improve technical analysis.
But that’s not all! We’ve also updated some of the geo maps in our collection, making them more accurate and detailed. Plus, we’ve squashed some pesky bugs in our Gantt, stock, map, and basic charts, ensuring an even smoother experience when handling specific, advanced cases.
Take a quick tour of the new indicators to discover how they can enhance technical analysis. We’ll also give you a brief overview of the other updates, so you can get the most out of our latest release. Let’s go explore!
- Categories: AnyChart charting component, AnyGantt, AnyMap, AnyStock, Big Data, Business Intelligence, Dashboards, Financial charts, Gantt Chart, HTML5, JavaScript, News, Stock charts
- No Comments »
Qlik Gantt & Sunburst’s Exciting New Features + Upgrades Across All Extensions!
April 18th, 2023 by AnyChart Team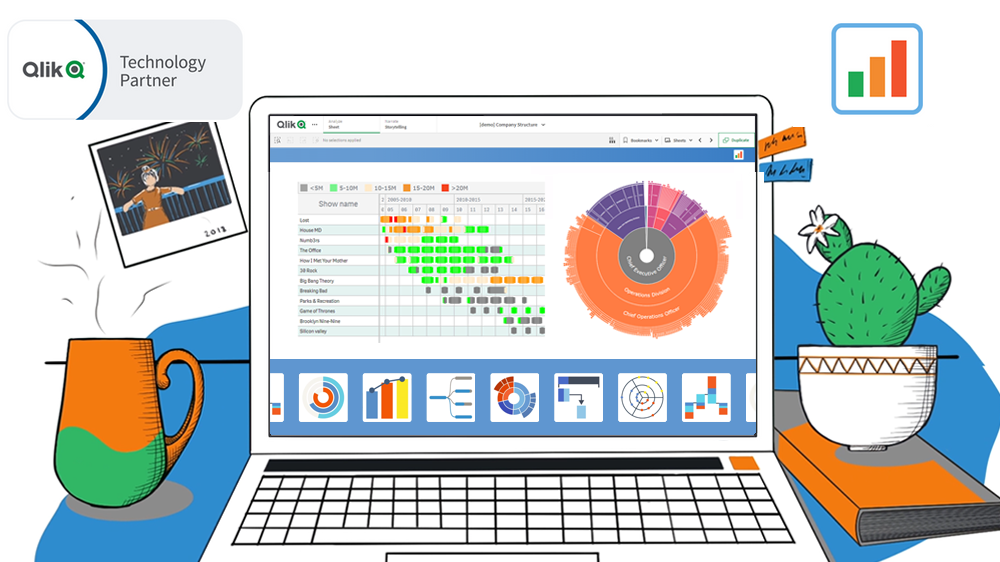 Hey Qlikkies! We have some exciting news to share with you today. AnyChart’s Qlik Sense Extensions have undergone a major update as we’ve made improvements across all of them, including the Decomposition Tree. However, we are particularly thrilled to announce the addition of some major features to our Sunburst Chart and Gantt Chart extensions.
But wait, there’s more! If you’re attending QlikWorld these days, we invite you to visit our team in Booth #180. There, you can try out the new features in action, ask questions, and learn more about how our extensions can improve your visual analytics experience in Qlik Sense. Don’t miss out on this chance to experience the AnyChart difference first-hand!
Our team has been hard at work, listening to your feedback and making improvements. We are confident that these new features will give you greater creative control and better performance in your Qlik-powered environment. So without further ado, let’s dive into the details of the major new upgrades!
Read more at qlik.anychart.com »
- Categories: AnyChart charting component, AnyGantt, Big Data, Business Intelligence, Dashboards, Gantt Chart, News, Qlik
- No Comments »
Join AnyChart at QlikWorld 2023: Sponsor & Exhibitor
April 14th, 2023 by AnyChart Team Get ready, because QlikWorld 2023 is coming in hot! From April 17th to 20th, Las Vegas will be bustling with all the latest and greatest in the world of data analytics, and AnyChart is pumped to be part of the action. Meet us in Booth #180!
Read more at qlik.anychart.com »
- Categories: AnyChart charting component, AnyGantt, Big Data, Business Intelligence, Dashboards, Gantt Chart, News, Qlik
- No Comments »
CEO Anton Baranchuk Receives 2023 DEVIES Award for AnyChart
February 16th, 2023 by AnyChart Team Last night was amazing: Anton Baranchuk, CEO and Co-founder of AnyChart, received our award for Best in Data Analytics and Visualization at DeveloperWeek’s DEVIES Awards ceremony in Oakland, California!
Check out some photos from the event in this quick story!
- Categories: AnyChart charting component, AnyGantt, AnyMap, AnyStock, Big Data, Business Intelligence, Financial charts, Gantt Chart, GraphicsJS, HTML5, JavaScript, News, Qlik, Stock charts
- No Comments »