AnyGantt Extension NOW Available in Qlik Sense Cloud Edition! [+ How-to-Install Video]
March 12th, 2020 by AnyChart Team Great news for Qlik users! AnyGantt Extension for Qlik Sense is now available in the cloud!
As of February 2020, customers using Qlik Sense in the cloud can benefit from 3rd party extensions such as those by AnyChart, a trusted Qlik Technology Partner.
Read more at qlik.anychart.com »
- Categories: AnyChart Charting Component, AnyGantt, Big Data, Business Intelligence, Dashboards, Gantt Chart, News, Qlik
- No Comments »
Try Updated AnyGantt Extension for Qlik Sense with New Stunning Features
January 22nd, 2020 by AnyChart Team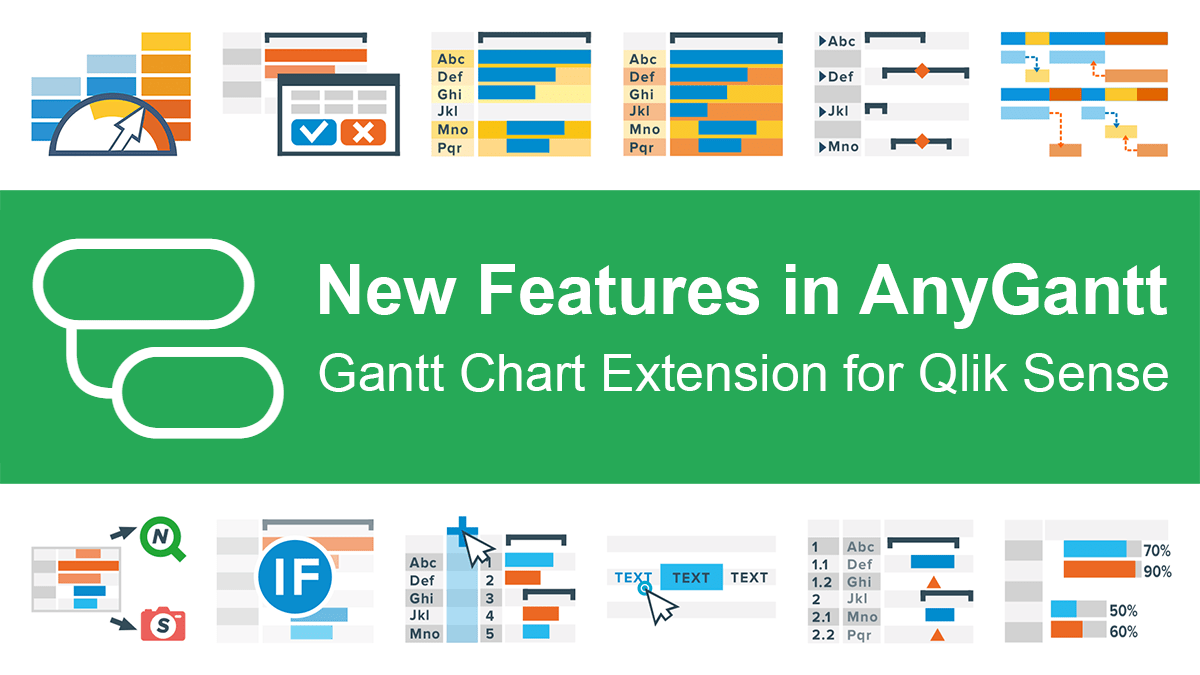 Great news for Qlikkies: We released another major update to our AnyGantt extension for Qlik Sense, which will further enhance your project data visualization experience. So the current 4th generation of our solution for Gantt charts in Qlik already delivers a whole bunch of new awesome features and improvements — learn about them now in a quick overview.
Read more at qlik.anychart.com »
- Categories: AnyChart Charting Component, AnyGantt, Big Data, Business Intelligence, Gantt Chart, News, Qlik
- No Comments »
Qlik Sense Gantt Chart Extension AnyGantt Gets New Awesome Features in Version 4.0
November 1st, 2019 by AnyChart Team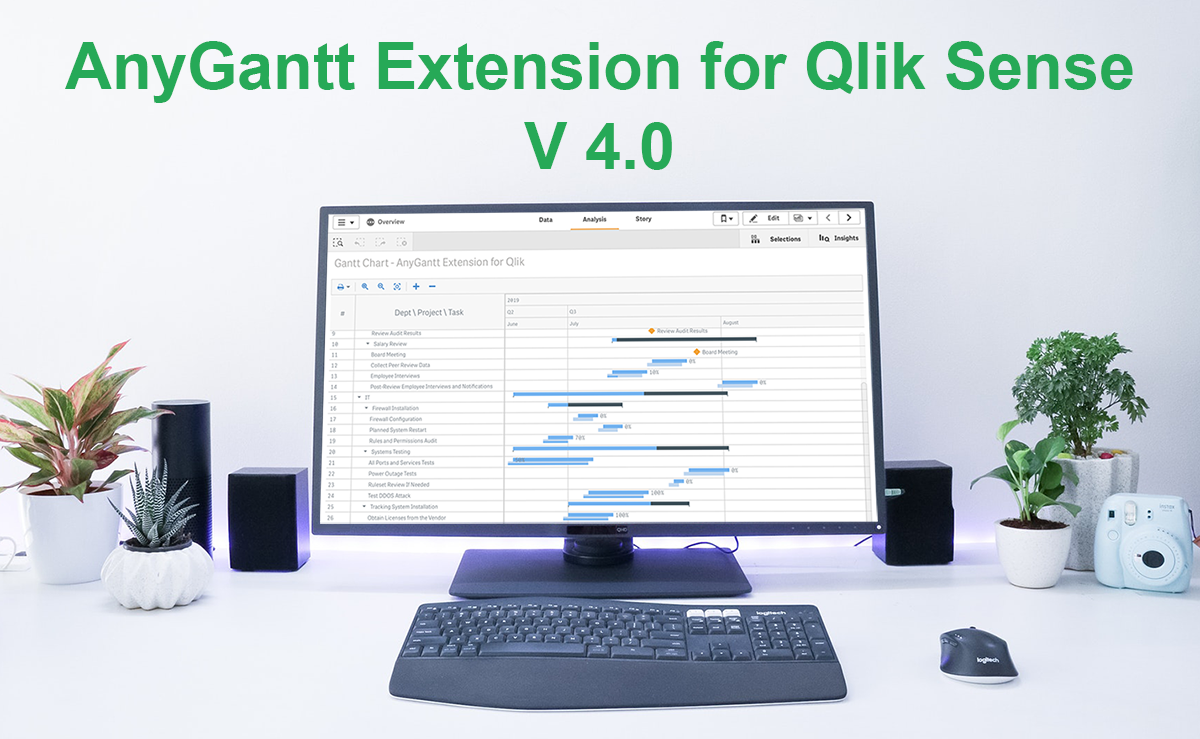 Good news, Qlikkies! We’ve released a major update to our Qlik Sense Gantt chart extension AnyGantt, bringing a bunch of new awesome features to further improve your project and resource data visualization experience using it. Look what’s new in version 4.0!
Read more at qlik.anychart.com »
- Categories: AnyChart Charting Component, AnyGantt, News, Qlik
- No Comments »
How to Create Gantt Chart in Qlik Sense Using AnyGantt Extension for Smart Project Data Visualization
September 11th, 2019 by AnyChart Team Looking for the simplest way to create a Gantt chart in Qlik Sense to further streamline data-driven project management in your company or organization? We’ll show you one right now! Follow this quick tutorial and you’ll learn how to easily visualize project tasks and activities as data in a matter of minutes — on smart, interactive Gantt charts using the intuitive AnyGantt extension for Qlik by AnyChart.
Watch the video tutorial or follow the text-and-pictures version — you choose!
Read more at qlik.anychart.com »
- Categories: AnyChart Charting Component, AnyGantt, Big Data, Business Intelligence, Gantt Chart, Qlik
- 3 Comments »
All 3 Extensions for Qlik Sense Updated with New Charting Features in Version 3.4
June 19th, 2019 by AnyChart Team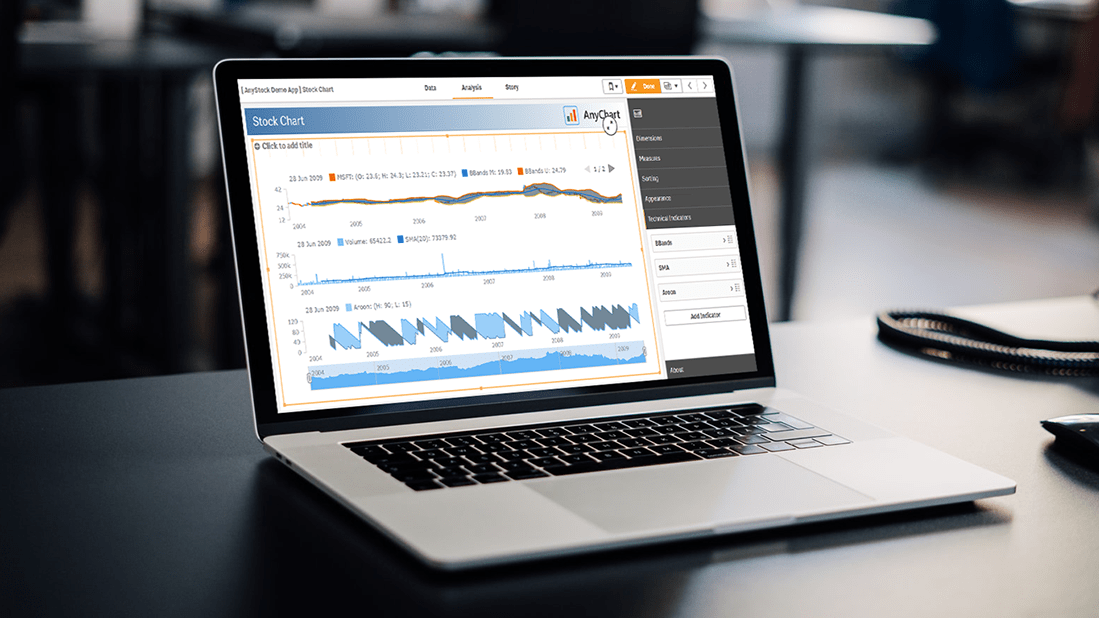 Hey Qlik users, we are happy to announce the release of version 3.4 for all our three extensions for Qlik Sense! We updated them with new awesome data visualization features and functionality such as technical indicators and more.
At last month’s Qlik Qonnections 2019 conference in Dallas where we exhibited as a new Qlik Technology Partner, we received amazing feedback from the Qlik community. We took that information and have already begun building out some of those requests for our next release of version 3.5 for our extensions for Qlik Sense, so please keep the feedback coming and we’ll keep building.
In the meantime here’s what we added.
Read more at qlik.anychart.com »
- Categories: AnyChart Charting Component, AnyGantt, AnyMap, AnyStock, Business Intelligence, Gantt Chart, Qlik, Stock Charts
- No Comments »
AnyChart Joins Qlik Technology Program and Adds 36 Chart Types to Qlik Sense in Just-Launched Extensions
May 7th, 2019 by AnyChart Team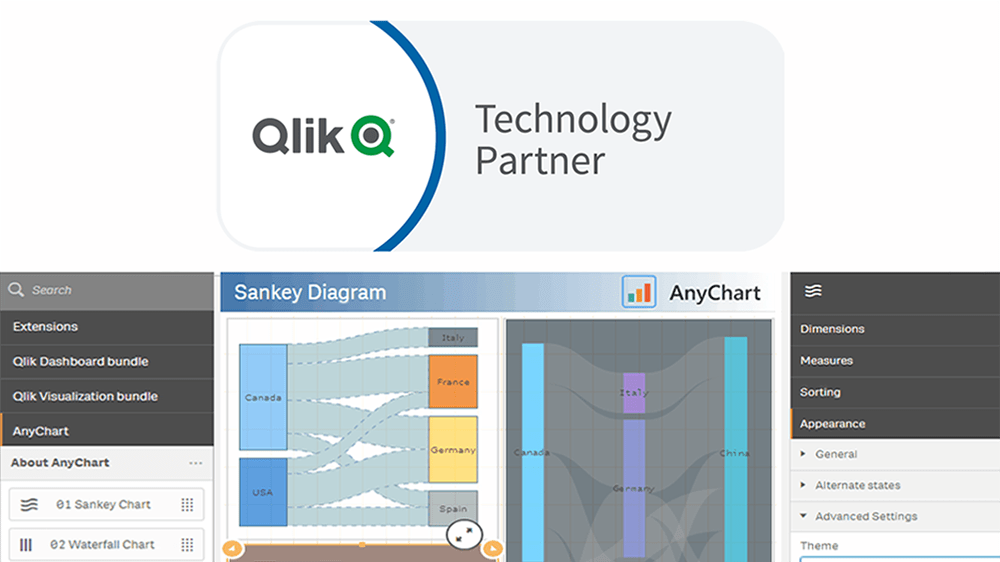
“We’re excited to be partnering with AnyChart, and their extensions will provide customers with additional choices for building even more compelling visualizations.”
— Mike Foster, Vice President, Strategic Partners at Qlik.
(Source: press release as of May 7, 2019.)
AnyChart crosses a new frontier! The vast data visualization capabilities of our award-winning JavaScript charting library, designed primarily for web developers and software engineers, are now available directly to data analysts and BI experts through powerful, flexible, intuitive extensions for Qlik Sense — AnyChart, AnyGantt, and AnyStock!
Read more at qlik.anychart.com »
- Categories: AnyChart Charting Component, AnyGantt, AnyStock, Big Data, Business Intelligence, Qlik
- 13 Comments »
Qlik Data Visualization Extension: Introducing Custom Drawing Over Custom Theme
January 16th, 2019 by Irina Maximova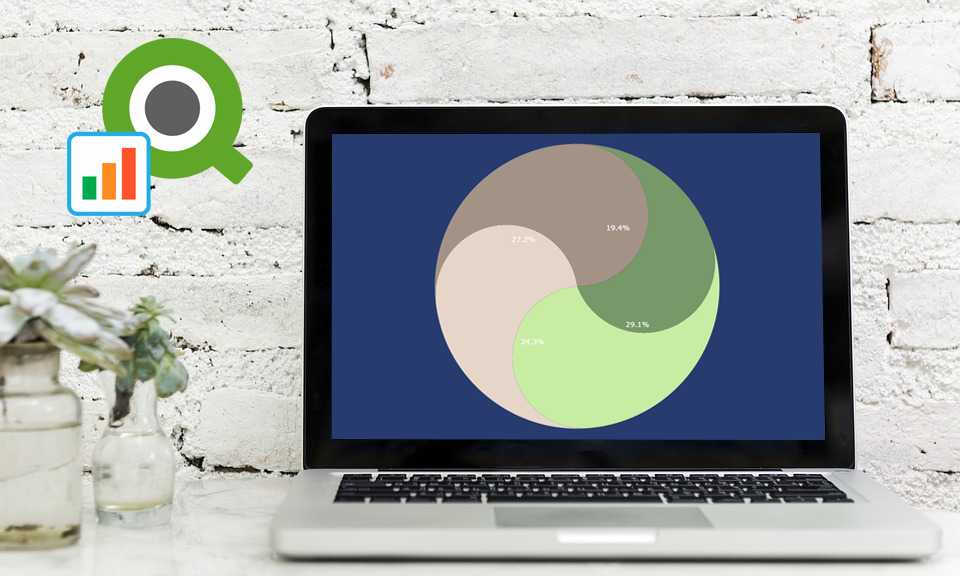 Our Qlik Charts Extension now allows a custom renderer to be set for certain chart types! We’ll show you how to make use of this new great feature in your Qlik data visualization practice, implementing custom drawing over a custom theme.
Before we begin, please note: We recommend getting acquainted with the custom drawing documentation of AnyChart JS Charts if you never worked with it before. When you do that, it will be easier for you to understand what the custom drawing functions are and how to use them right and best.
- Categories: AnyChart Charting Component, Business Intelligence, HTML5, News, Qlik, Tips and Tricks
- No Comments »