AnyStock 1.5.1 Available
October 30th, 2011 by Margaret SkomorokhAnyStock 1.5.1 update is available for download at our site. It includes some significant changes:
Bug fixes
- IMPORTANT: Formatting rules now enforce escaping comma when it is used as a decimal or thousand separator. In the previous version you could use something like that: {%Value}{decimalSeparator:,} although documentation states that comma should be escaped by back slash. Since 1.5.1 rules are strict, and only the following expression works correctly: {%Value}{decimalSeparator:,}.
If you are upgrading from previous versions, you should check your configs and change them so that they followed the comma escaping rule.
- Formatting in value highlighter now works correctly.
- addEventMarker method now works correctly with localeBasedDate.
- Scroller events are now fired in the correct order when unselected area is clicked.
- Null values are now correctly treated as nulls (not zeros).
- MFI indicator now reads the period parameter correctly.
Improvements
- onAnnotationRemove event now returns not only the ID of a removed annotation, but also this annotation as an object — a useful improvement for implementing an “Undo” feature.
- Full compatibility with Flex 4.5 Mobile SDK — you can use AnyStock SWC in your iOs or Android Flex projects.
- Range preset buttons behavior improved, particularly when you sync two different chart objects at one page.
Documentation updates
- Updating Event Markers Visual Settings Using JavaScript sample from Online HTML/JavaScript Samples Center has been fixed.
- onAnnotationRemove description was updated in JavaScript API Reference and AnyChart Stock Flex Component: API Reference.
Version history: http://6.anychart.com/products/anystock7/history/
Trial download: https://www.anychart.com/download/
- Categories: AnyStock
- No Comments »
AnyChart Team Developed Ctags for JavaScript based on Google Closure Compiler
October 4th, 2011 by Margaret SkomorokhDeveloping the HTML5 version of AnyChart, our team has not only mastered a variety of tools and utilities, but also created a number of new ones – including Ctags for JavaScript based on Google Closure Compiler (gjstags).
Ctags is a program that generates an index (or tag) file of names found in source and header files of various programming languages. These tags allow definitions to be quickly and easily located by a text editor or other utility. Alternatively, there is also an output mode that generates a cross reference file, listing information about various names found in a set of language files in human-readable form.
Gjstags developed by AnyChart team supports classes, enums, interfaces, and so on. It is based on Google Closure Compiler, works under Mac OS X or Linux and is licensed under Apache License 2.0.
Anyone interested in gjstags can download it here: https://github.com/AnyChart/gjstags and is free to use it in any way.
- Categories: Uncategorized
- No Comments »
AnyChart Supports Bitcoin Project
September 29th, 2011 by Timothy Loginov![]() AnyChart has licensed out AnyStock — the best web component for time-based and financial data visualization — to Bitcoin2 project, thus becoming its technology sponsor.
AnyChart has licensed out AnyStock — the best web component for time-based and financial data visualization — to Bitcoin2 project, thus becoming its technology sponsor.
Bitcoin is an open source peer-to-peer network created in 2009 by Satoshi Nakamoto (whose real identity is unknown).
It tracks and verifies transactions in bitcoins — a digital currency which is generated by Bitcoin software. When the program is run, users’ computers are constantly trying to solve cryptographic puzzles to get bitcoins as a reward. As more coins are generated, the puzzles get harder, and the reward goes down, which makes Bitcoin a deflationary currency. Bitcoins can be converted to and from other currencies, primary by online exchange services. In August 2011, there were over 7.1 million bitcoins in existence.
Currently, a new version of the Bitcoin algorithm is developed – Bitcoin2. Its aim is to raise bitcoins’ liquidity by making transactions safer, creating a congenial investment climate for financial companies, and providing person identification tools so that the system could be used within the international legal framework.
Bitcoin’s ideology is close to crypto-anarchism that expounds the use of strong public-key cryptography to bring about privacy and freedom.
- Bitcoin2 Project — a new generation of virtual currency for B2B and B2C.
- AnyStock — Stock and Financial Flash Charting Component.
- Categories: Uncategorized
- No Comments »
AnyChart 6.0.1 Update
September 12th, 2011 by Timothy LoginovAnyChart 6.0.1 is published and live on our site, we are working hard on HTML5 engine, and this week the following changes have been made:
- Funnel chart type
- Custom attributes feature
Version history: http://6.anychart.com/products/anychart7/history/
Trial download: https://www.anychart.com/download/
- Categories: AnyChart Charting Component
- No Comments »
AnyChart 6.0 with HTML5 Support Available
September 5th, 2011 by Margaret Skomorokh![]()
We are glad to announce the release of AnyChart 6.0 containing an HTML5 (SVG based) version of our component.
Our aim is to make the HTML5 version a complete substitution for the Flash version as well as to make the switch to HTML5 as easy as possible. Another thing that we see as a highest priority is the compatibility of our component with different browsers and platforms.
So key features of the HTML5 version are the following:
- HTML5 charts are configured exactly the same way as Flash ones – in XML.
- The names of API methods are the same.
- The HTML5 version is designed to work in all up-to-date versions of popular desktop browsers, such as Chrome, Safari, Firefox, Internet Explorer, and Opera.
- It is also compatible with popular browsers for the mobile platforms Android (2.2+) and iOS (iPhone, iPad, iPod Touch).
Though we have fully integrated the HTML5 version with our documentation as well as with the redistributable package, HTML5 support is still in the beta phase. Not all chart types and not all features are available for the moment, and we do not yet guarantee that all your charts in SVG version will look and work exactly like they do in Flash version.
However, we are going to cover all Flash version features by the HTML5 engine by the end of the year, and you will be able to upgrade your charts without any significant changes in your web sites and applications.
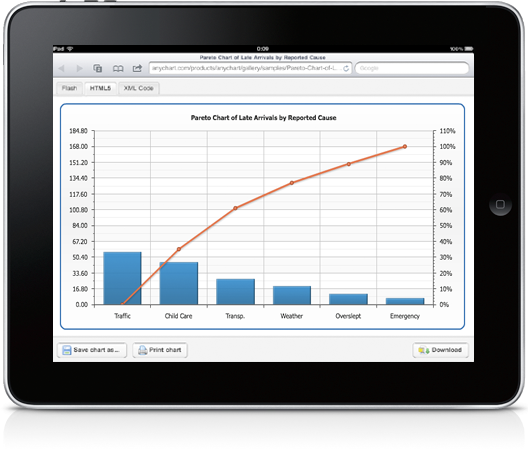
You can see how our HTML5 engine works in the examples from the Documentation and Gallery sections – just select an HTML5 tab when you view a chart. In case the features required to display a certain sample are not ready yet, you will see a relevant message.
To review an instruction on implementation, see HTML5 Migration Guide tutorial.
We are working hard to make the HTML5 version work exactly like the Flash version, and AnyChart will be updated each 1 or 2 weeks this fall. Check our web site or subscribe to our blog RSS or Twitter to be always aware of the latest changes.
Thank you once again for the interest in AnyChart – Modern Data Visualization Solution.
- Categories: AnyChart Charting Component
- No Comments »
AnyStock 1.5.0 Released
August 22nd, 2011 by Margaret SkomorokhWe have released an update of AnyChart Stock and Financial Charts, AnyStock 1.5.0, with the following changes:
New features
- The ability to set different left and right timescale margins in pixels has been added. Read more at: Timescale Right and left paddings.
- We have added a new parameter in the applySettingsChanges() method: preserveSelectedRange, which allows to preserve selected range when chart settings are modified.
Bug fixes
- The bug in the version 1.4.0 that lead to incorrect placement of event markers is fixed.
So if you work with AnyStock 1.4.0 and use the event markers feature, you have to update to the version 1.5.0.
Documentation updates
- Basic and Advanced Samples for AnyStock Flex have been added. See AnyChart Stock Flex Component: Your First Chart and AnyStock Flex Stock Portal.
Download AnyStock 1.5.0: https://www.anychart.com/download/
Version history: http://6.anychart.com/products/anystock7/history/
- Categories: AnyStock
- No Comments »
AnyStock 1.4.0 Available
July 6th, 2011 by Margaret SkomorokhThe ability to set left and right timescale paddings in pixels was in extreme demand, and we always do our best to provide our customers with as wide range of built-in technical indicators as possible – so we have decided not to put off the AnyStock 1.4.0 update that gives you the full control of timescale margins and three new technical indicators:
Thus, AnyStock has become even better than before and now supports already 30 built-in and ready-to-use technical indicators.
Download AnyStock 1.4.0: https://www.anychart.com/download/
Version history: http://6.anychart.com/products/anystock7/history/
- Categories: AnyChart Charting Component
- No Comments »
AnyChart 5.1.3 Released
July 6th, 2011 by Margaret SkomorokhWe are proud to announce the availability of the long-awaited AnyChart 5.1.3 with new chart types and numerous fixes and improvements!
New chart types
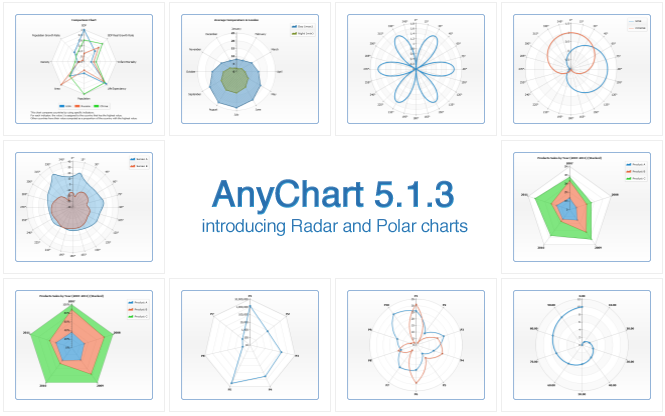
- Radar Chart
A radar chart is a graphical method of displaying multivariate data. Variables are represented on axes starting from the same point, where the relative position and angle of the axes is uninformative. It is also known as spider chart, star chart, kiviat diagram, etc. AnyChart allows displaying three types of series on radar charts: Line, Area and Marker. - Polar Chart
A polar chart is a plot drawn on a circular grid, showing trends in values on the basis of angles: each point on a plane is determined by a distance from a fixed point and an angle from a fixed direction. AnyChart allows drawing Line, Area and Marker series on polar plots.
New features
- A new external method that allows animating updated values.
- New formatting keywords that allow controlling the number of characters in token: maxChar and maxCharFinalChars.
- New parameters in chartMouseMove, pointMouseOut, pointMouseOver events: mouseX and mouseY.
- Multiseries pie and donut charts can now use outside labels with connectors.
Bug fixes
- Minor missing values interpolation algorithm issue is fixed.
- Flex component “tooltip stick” problem is solved.
- Wrong positioning of labels for points with zero value is fixed.
Download AnyChart 5.1.3: https://www.anychart.com/download/
Version history: http://6.anychart.com/products/anychart7/history/
- Categories: AnyChart Charting Component
- No Comments »
AnyStock 1.3.0 Available
July 1st, 2011 by Margaret SkomorokhToday, AnyChart Stock and Financial Charts 1.3.0 is available. In the new version, several important improvements have been made:
New technical indicators
New features
- Ability to bind Y-Axis markers to series values to display chart data on the axis. Read more about this feature in User’s Guide article: Y-Axis Markers: Binding to series values.
- Ability to get data set content using the getDataSetCSV() method. You can see how it works in the following example: Online HTML/JS Sample Center: Exporting CSV data.
- A new method getCurrentYAxisInfo() that allows getting scale minimum, maximum and interval values when they are calculated automatically.
Bug fixes
- Grouping of data provider fields with “High” and “Low” approximation types was incorrect.
- Volume+MA indicator worked improperly with ma_period attribute. This error has been fixed.
Download AnyStock 1.3.0: https://www.anychart.com/download/
Version history: http://6.anychart.com/products/anystock7/history/
Roadmap: http://6.anychart.com/products/anystock7/roadmap/
- Categories: AnyStock
- No Comments »
AnyStock 1.1.1 Released
May 17th, 2011 by Timothy LoginovA new version of AnyChart Stock and Financial Charts is available – AnyStock 1.1.1.
In this version, a new navigation feature has been added: users can now quickly select a particular area of a plot by holding the SHIFT key and moving a mouse, the video below illustrates this feature (and you can do it yourself on any AnyStock chart):
There is also an update of our help materials: a new sample has been added to Online HTML/JS Samples Center: Synchronizing Selected ranges in Two Different Chart Objects.
Two bugs have been fixed. Firstly, when allow_edit attribute forbids editing annotations, the points beneath them are now highlighted correctly. Secondly, using the applySettingsChanges() method no longer makes annotations invisible, and doesn’t prevent from adding new annotations.
Here is the roadmap for future versions of AnyStock: http://6.anychart.com/products/anystock7/roadmap/
- Categories: AnyStock
- No Comments »