AnyStock 1.8.0 Available
January 22nd, 2013 by Timothy LoginovA new version of AnyChart Stock and Financial Charts is available – AnyStock 1.8.0. In this version you will find a number of great new features and improvements. Now you can easily show positive and negative Infinity on your chart, enjoy full support for the scientific number format in CSV, and use some other new options. For more detailed information, please see links to our documentation and Knowledge Database.
New features
- Date Grouping Modes improvement (see KB).
- +Infinity/-Infinity values support (see KB).
- New events: onGotData, onNoData.
- New methods: showOverlayMessage, hideOverlayMessage.
- Value Highlighter for Y-Axis.
- Text and extra timestamp fields support.
- Hand cursor option for Event Markers.
- Full screen button feature.
- New number formatting token: scientific number formatting.
Improvements
- Full support for the scientific number format in CSV.
- Single point data sets display is improved.
Bugfixes
- NaN labels no longer show up when extra axes with no series bound are used.
- Preset buttons are now updated properly when the StockMain.selectRange() method is used.
- Minor calculation issues with Y-Axis scale are fixed.
- Point order on multiple append is now treated correctly.
Note: if you are using the applySettingsChanges() method along with drawing annotations, you may encounter errors on update if any of the charts doesn’t have an id, so please always assign an id to the chart in such cases.
Here you can see AnyStock version history: http://6.anychart.com/products/anystock7/history/
The new version is available for trial download: https://www.anychart.com/download/
- Categories: AnyStock
- No Comments »
AnyChart 6.0.11 Released
November 30th, 2012 by Margaret Skomorokh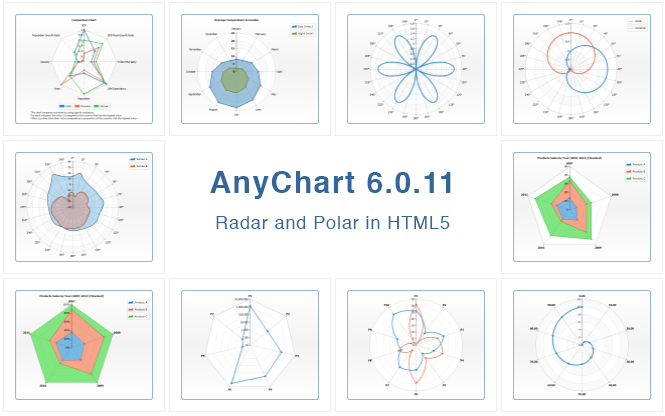
We are glad to announce that AnyChart 6.0.11 is now available for download. Our team keeps improving the HTML5 engine and broadening the range of features supported by it. We have also made a number of important bug fixes both for the HTML5 and Flash engine.
New HTML5 features:
- Radar plots
A radar plot is a graphical method of displaying multivariate data. Variables are represented on axes starting from the same point, where the relative position and angle of the axes is uninformative. It is also known as spider chart, star chart, kiviat diagram, etc. AnyChart allows displaying three types of series on radar charts: Line, Area and Marker. - Polar plots
A polar plot is a plot drawn on a circular grid, showing trends in values on the basis of angles: each point on a plane is determined by a distance from a fixed point and an angle from a fixed direction. AnyChart allows drawing Line, Area and Marker series on polar plots. - Indicator and Bulb gauges
- Label gauges
- Circular gauges (now fully supported)
HTML5 bug fixes:
- The getInformation() method obfuscation problem with Gauge charts is fixed.
- Axis Crossing attribute problems are fixed.
- Bar/Line overlay problems are fixed.
Flash bug fixes:
- Flex component no longer throws an error when the legend is enabled in charts.
- Marker series are now properly animated.
And the last, but not the least: we have solved the problem with maps in Chrome. Pepper Flash Chrome plugin peculiarities make it impossible for AnyMap of earlier versions to work properly, and there is only way to avoid this for sure: upgrade to AnyChart 6.0.11.
The full list of improvements: http://6.anychart.com/products/anychart7/history/
Trial download: https://www.anychart.com/download/
- Categories: AnyChart Charting Component
- No Comments »
AnyStock 1.7.0 Released
July 11th, 2012 by Margaret SkomorokhWe are proud to announce the release of AnyChart Stock and Financial Charts 1.7.0. We have made some significant changes and added a number of new features. Some of the improvements impact the default settings. Please take a moment to familiarize yourself with these changes prior to deploying.
The most important changes are in Fibonacci annotations settings and defaults: they have new defaults and are displayed in a new, different, and better way. Level labeling has been added and enabled by default. Fibonacci Fan now shows not only price levels but also time levels and a grid. If you upgrade to 1.7.0 and use Fibonacci annotations, you will see changes in your charts. However, you can revert to the old view by specifying additional settings in your configuration files.
Additionally, the <export> node is deprecated and replaced by the <export_settings> node, so it is strongly recommended to review your configuration files and make the necessary changes. In JSON configuration this replacement means: export turns into exportSettings. These changes are made to avoid problems with the objectModel chart property in Internet Explorer.
New features
- Fibonacci drawing tools have been significantly improved: you can tune the number and ratios of levels, add level labels, and so on. See:
- New positioning features for Event Markers: now you can place them below series and take into account series values. See Event Markers: Positioning for more.
- New Y Axes scale attributes: scale_start_ratio and scale_end_ratio. They provide a way to overlay charts in a nice way, and are particularly useful when one wants to display a Volume chart on the same plot with a Price chart. See Y Axes Settings: Limiting Scale Draw Region for more.
- New Y Axes scale attrbutes: soft_minimum and soft_maximum. They provide additional tuning options for scale auto calculation modes. See Y Axes Settings: Soft Minimum and Soft Maximum: Tuning Auto Calculation.
Improvements
- The <export> node is deprecated due to the problems it gave when trying to obtain the objectModel property in Internet Explorer. Please use the <export_settings> node instead.
- The logarithmic axis minimum auto calculation is improved.
Bug fixes
- The Scroller thumbnail series no longer displays missing values at the end of a data set as zeros.
- A separated tooltip pin no longer breaks when a zero length range is selected.
- Event markers are properly bound to series fields.
- Flex version no longer throws the errors which occasionally presented themselves while working with the component.
- Fibonacci Arcs geometry issues are fixed.
- Flex iOs mouse over problems are fixed.
- The enabled attribute of the <line> subnode of major and minor grids in axes now works properly.
Here you can see AnyStock version history: http://6.anychart.com/products/anystock7/history/
The new version is available for trial download: https://www.anychart.com/download/
- Categories: AnyStock
- No Comments »
AnyChart 6.0.10 Available
July 11th, 2012 by Margaret SkomorokhA new version of our charting component is available – AnyChart 6.0.10. The improvements include:
New features
- Circular Gauges Beta have been added to the HTML5 engine.
- The Flex component now provides the getBase64PNG() and getBase64PDF() methods with optional width and height parameters.
Bug fixes for the HTML5 engine
- Custom attributes are now correctly set via JSON.
- Custom attributes are now correctly retrieved in point events.
- Action arguments are now correctly passed in JSON.
- The maxChar and maxCharFinalChars formatting options are now supported.
- The autocalculated datetime scale crash is fixed.
- The heatmap lower case row/column names problem is fixed.
- The first stack elements are no longer hidden when the Logarithmic scale is used with the Stacked mode.
Bug fixes for the Flash engine
- “On resize” crash in Flex applications is fixed.
- The getPNG(), getPDF(), saveAsImage(), and saveAsPDF() methods now properly handle optional width and height parameters.
- Marker series is now properly animated.
- Incorrect plot display in 3D mode with scroll enabled is fixed.
- Opacity is now correctly set in 3D “Aqua” pie charts.
- The first stack elements are no longer hidden when the Logarithmic scale is used with the Stacked mode.
- Tooltips are properly positioned in Flex applications with non-absolute layering used.
Here you can see AnyChart version history: http://6.anychart.com/products/anychart7/history/
The new version is available for trial download: https://www.anychart.com/download/
- Categories: AnyChart Charting Component
- No Comments »
AnyChart 6.0.9 Available
June 5th, 2012 by Margaret SkomorokhWe have released AnyChart 6.0.9, and now our HTML5 engine supports the following features:
- blur effect in 3D Pie Charts,
- cone shape in Bar Series,
- dashed lines,
- hatch fill.
We also have fixed a number of bugs, mostly of the HTML5 engine:
- HTML5 engine no longer creates functions and variables in the global document namespace.
- Memory leak problem in TreeMaps and AxisBased charts is solved.
- Multiple axes markers display problems is solved.
- The {%AxisMax} and {%AxisMin} tokens are calculated properly now.
Here you can see AnyChart version history: http://6.anychart.com/products/anychart7/history/
The new version is available for trial download: https://www.anychart.com/download/
- Categories: AnyChart Charting Component
- No Comments »
AnyChart 6.0.8 Released
February 28th, 2012 by Margaret SkomorokhAnyChart 6.0.8 is available for download. We keep improving our HTML5 engine and fixing the bugs discovered there. We would also like to draw your attention to Vertical and Horizontal Gauges, this instrument being absolutely necessary if you want to show Key Performance Indicators and Bullet Graphs in Scorecards and Dashboards. As for basic chart types, we have added a couple of useful features, without which it is sometimes very difficult to go.
HTML5 engine now supports:
- Vertical and Horizontal Gauges
- the TreeMap plot
- Aqua styles for 2D Pie and 2D Doughnut chart types
- 3D Pie and 3D Doughnut chart types
New labels features:
- Added the possibility to set a fixed width for Y-axis labels.
- Added the possibility to set a fixed width for X-axis labels and to wrap text.
Version history: http://6.anychart.com/products/anychart7/history/
Trial download: https://www.anychart.com/download/
- Categories: AnyChart Charting Component
- No Comments »
Holiday Greetings 2011
December 27th, 2011 by Margaret SkomorokhHoliday greetings and our best wishes for a happy and prosperous New Year!
During the last year AnyChart has made another big step forward. We have successfully implemented new technologies and improved our products. The family of our customers has grown up, as well as our team (new departments have been opened this year). We are sure that our charts will keep delighting your eye, and that AnyChart is a part of the future of web and charting technologies.
Let the new year be productive and joyful for all of us. And to get into the festive mood, take a look at the picture of a dragon sleigh:

- Categories: Uncategorized
- No Comments »
AnyChart Stock 1.6.0 Released
December 26th, 2011 by Margaret SkomorokhToday we have released AnyChart Stock 1.6.0. This version includes the following changes:
New features
- The ability to specify Z-Index for series to define custom display order for regular series and technical indicators series. Read more about this feature at Series common settings: Z-Index.
- The ability to pin a certain value on a value scale to ensure its visibility. For more information, please see: Y-Axes Settings: Pinned Value.
Bug fixes
- Dashed line annotation slow rendering bug has been fixed.
- The fieldType property in the object model is no longer ignored after calling the applySettingsChanges method.
Version history: http://6.anychart.com/products/anystock7/history/
Trial download: https://www.anychart.com/download/
- Categories: AnyStock
- No Comments »
AnyGantt 4.2.0 Available
November 15th, 2011 by Margaret SkomorokhOur component for building Gantt charts has been updated. The new version – AnyGantt 4.2.0 – contains the following changes:
- AnyGantt JS integration library has been refactored:
— AnyChart.js is now named AnyGantt.js;
— AnyChart class is now called AnyGantt.Please note, that you have to change these names in your JS code when upgrading.
- A Flex version of AnyGantt component. Read more at Working with Gantt Chart in FLEX.
- Expand and collapse tasks using JavaScript.
- Scroll and Zoom using JavaScript.
- dateTimeRangeChange, verticalPositionChange and expandCollapse events to handle changes in data plot.
- Printing fixes.
Version history: http://6.anychart.com/products/anygantt7/history/
Trial download: https://www.anychart.com/download/
Download for registered customers: https://www.anychart.com/customer_area/
- Categories: AnyGantt
- No Comments »
AnyChart 6.0.5 Released
November 14th, 2011 by Timothy LoginovToday we are glad to announce the release of AnyChart 6.0.5. We are constantly improving the HTML5 engine, and soon it will become fully functional. Besides that, we keep adding new features and refining various aspects of AnyChart, including the smallest details (which, as we believe, are never insignificant) to make it more and more convenient to use.
In AnyChart 6.0.5 we have introduced a number of important improvements:
- A new Scale Auto Calculation Mode – Axes Scales: Scale Auto Calculation Modes.
- A new scale attribute always_show_zero – Axes Scales: Always Show Zero in Auto Calculation Mode.
- AnyChart Flex Component can now be used in Android applications.
- AnyChart Flash Integration can now be used in iOs applications.
- The getInformation() method now returns gauges and pointers collection for Gauge charts.
- AnyChart() constructor can now have up to three parameters, where the third parameter is a custom chart id.
- Chart custom messages are now configured in a different way: properties are replaced with a messages object. Read more in the Preloader tutorial.
- The getPNG() function now have two optional parameters: width and height. Read more in the Save as Image tutorial.
- Series now have a new attribute – enabled – which allows to hide them when a chart is rendered and then show again using the showSeries() method. Read more in the tutorial on working with data in JavaScript.
- A number of features, such as label controls, color swatch control, actions, templates, and the apply_palletes_to attribute are now fully supported in the HTML5 engine.
Important note: Because of the bug in Flash Player 11.0.1.152 Radar and Polar charts are displayed incorrectly. If you use any of 5.x or 6.x AnyChart versions with this version of Flash Player, please, switch either to AnyChart 6.0.5 or to Flash Player 11.1.102.55 (or later).
For more bug fixes and version history, see: http://anychart7.com/products/anychart/history/
Trial download is available at: https://www.anychart.com/download/
Please, feel free to contact us if any questions arise. We appreciate our clients and work hard to anticipate their needs and keep pace with the latest demands of the industry, making our charts even more flexible and attractive.
- Categories: AnyChart Charting Component
- No Comments »