We are glad to announce that AnyChart 6.0.11 is now available for download. Our team keeps improving the HTML5 engine and broadening the range of features supported by it. We have also made a number of important bug fixes both for the HTML5 and Flash engine.
New HTML5 features:
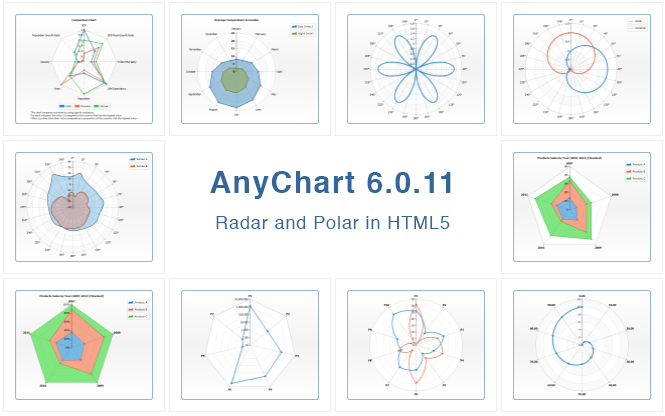
- Radar plots
A radar plot is a graphical method of displaying multivariate data. Variables are represented on axes starting from the same point, where the relative position and angle of the axes is uninformative. It is also known as spider chart, star chart, kiviat diagram, etc. AnyChart allows displaying three types of series on radar charts: Line, Area and Marker. - Polar plots
A polar plot is a plot drawn on a circular grid, showing trends in values on the basis of angles: each point on a plane is determined by a distance from a fixed point and an angle from a fixed direction. AnyChart allows drawing Line, Area and Marker series on polar plots. - Indicator and Bulb gauges
- Label gauges
- Circular gauges (now fully supported)
HTML5 bug fixes:
- The getInformation() method obfuscation problem with Gauge charts is fixed.
- Axis Crossing attribute problems are fixed.
- Bar/Line overlay problems are fixed.
Flash bug fixes:
- Flex component no longer throws an error when the legend is enabled in charts.
- Marker series are now properly animated.
And the last, but not the least: we have solved the problem with maps in Chrome. Pepper Flash Chrome plugin peculiarities make it impossible for AnyMap of earlier versions to work properly, and there is only way to avoid this for sure: upgrade to AnyChart 6.0.11.
The full list of improvements: http://6.anychart.com/products/anychart7/history/
Trial download: https://www.anychart.com/download/
- Categories: AnyChart Charting Component
- No Comments »