Robust data visualization makes complex subjects easier to see and understand. DataViz Weekly is our ongoing series collecting the best examples we come across most recently. Check out what stood out to us this week:
- Causes of death across countries — Our World in Data
- Cuba’s oil crisis — Reuters
- Family business succession wave — The Economist
- Three years of war in Sudan — Al Jazeera

Data Visualization Weekly: April 10–17, 2026
Causes of Death Across Countries
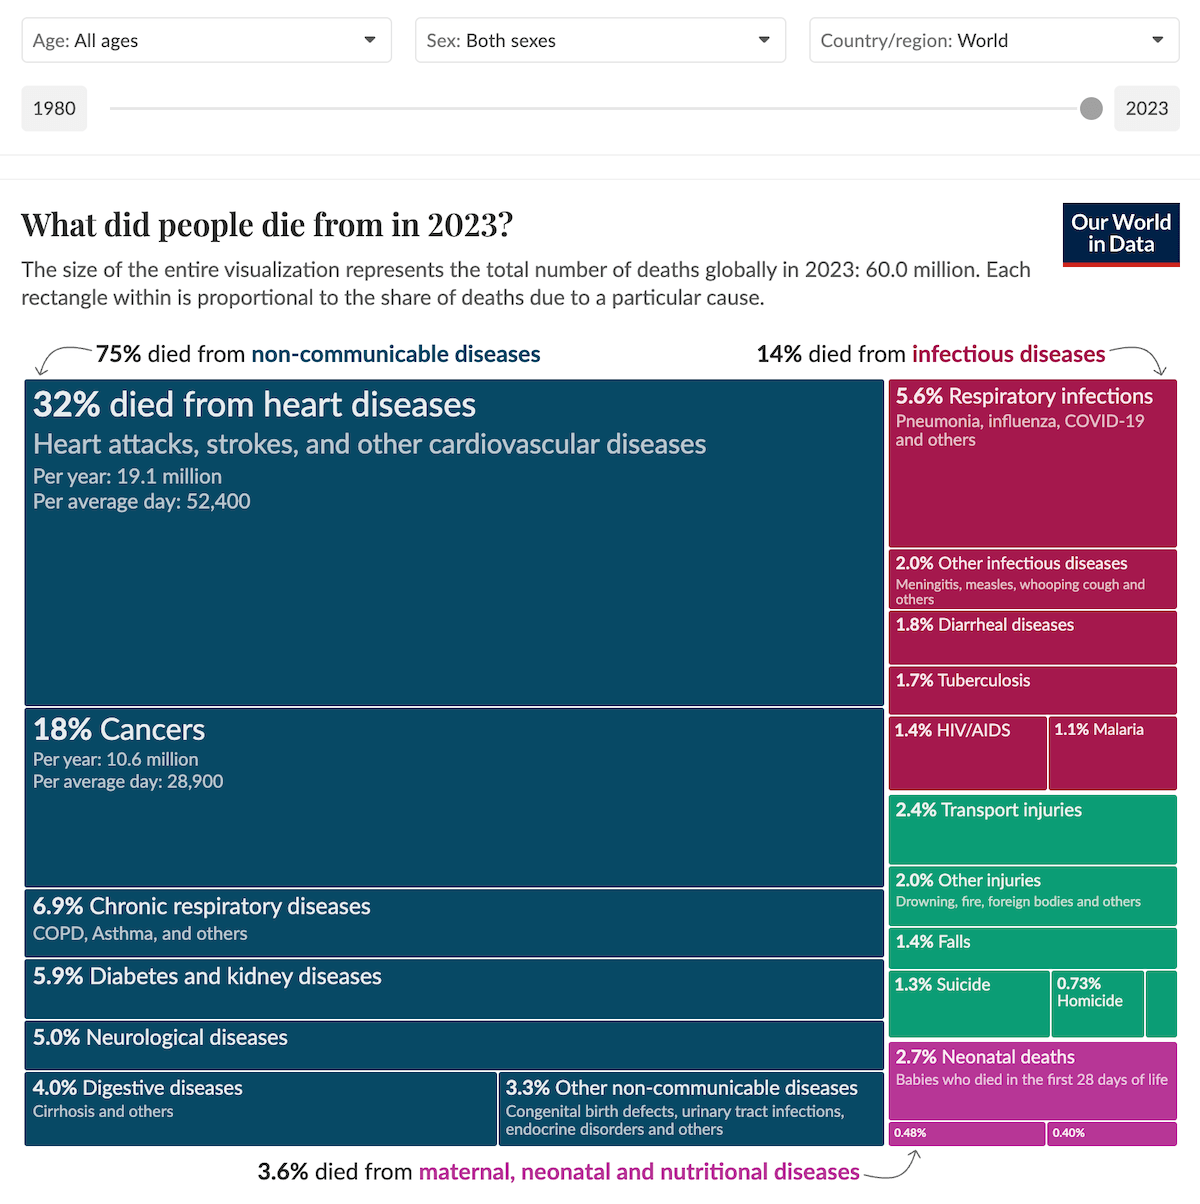
Around 165,000 people die every day around the world. The causes behind those deaths look very different depending on where in the world you live.
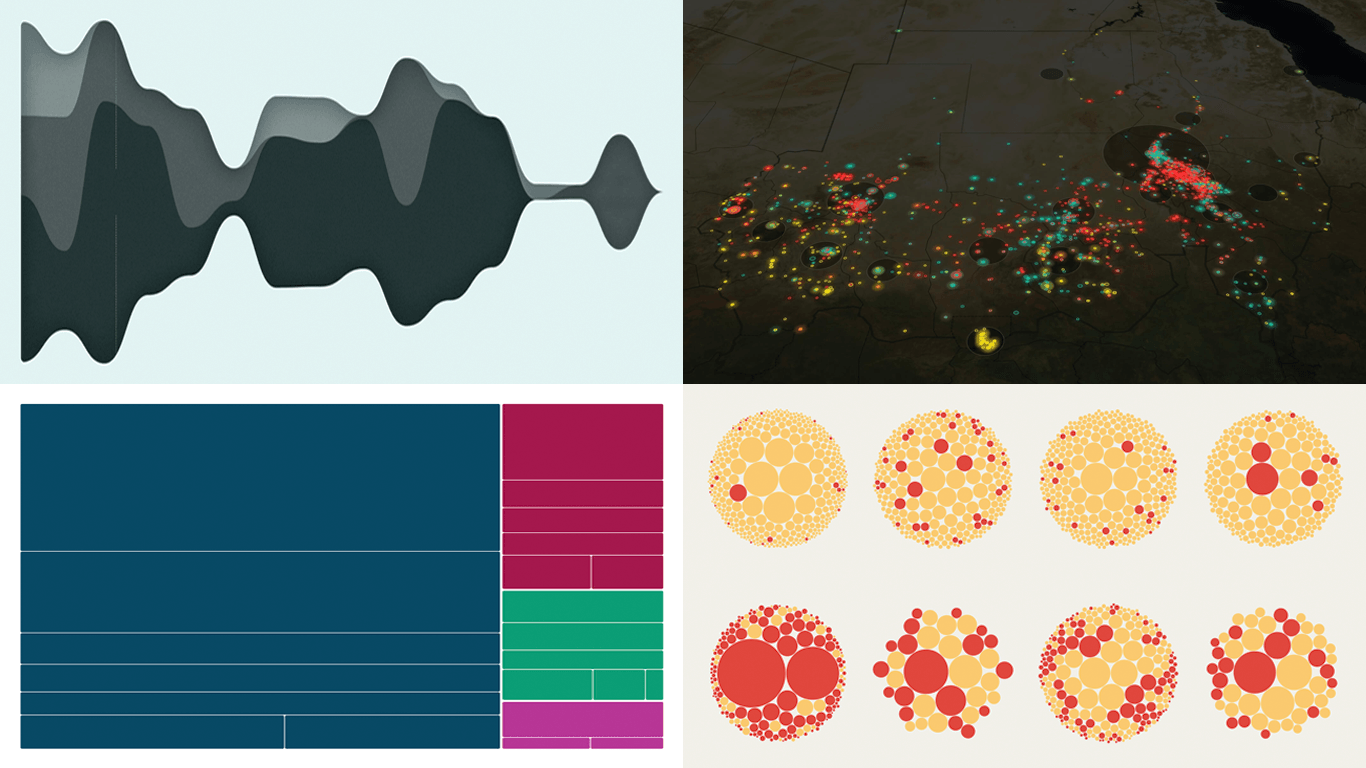
Our World in Data published an interactive treemap built by Sophia Mersmann and Fiona Spooner using data from the IHME’s Global Burden of Disease study. Each rectangle represents a cause of death, sized proportionally to its share of total mortality. A color system divides causes into four broad groups: non-communicable diseases in blue, infectious diseases in red, injuries in green, and neonatal and maternal deaths in purple.
The visualization is available in an article by Hannah Ritchie that opens with a global view, then steps through the same format for low-income and high-income countries separately, making the structural differences between them immediately visible. The fully interactive version at the end lets you select a country or region, filter by year — with data spanning over four decades — and narrow by age group or sex.
See the article on Our World in Data.
Cuba’s Oil Crisis
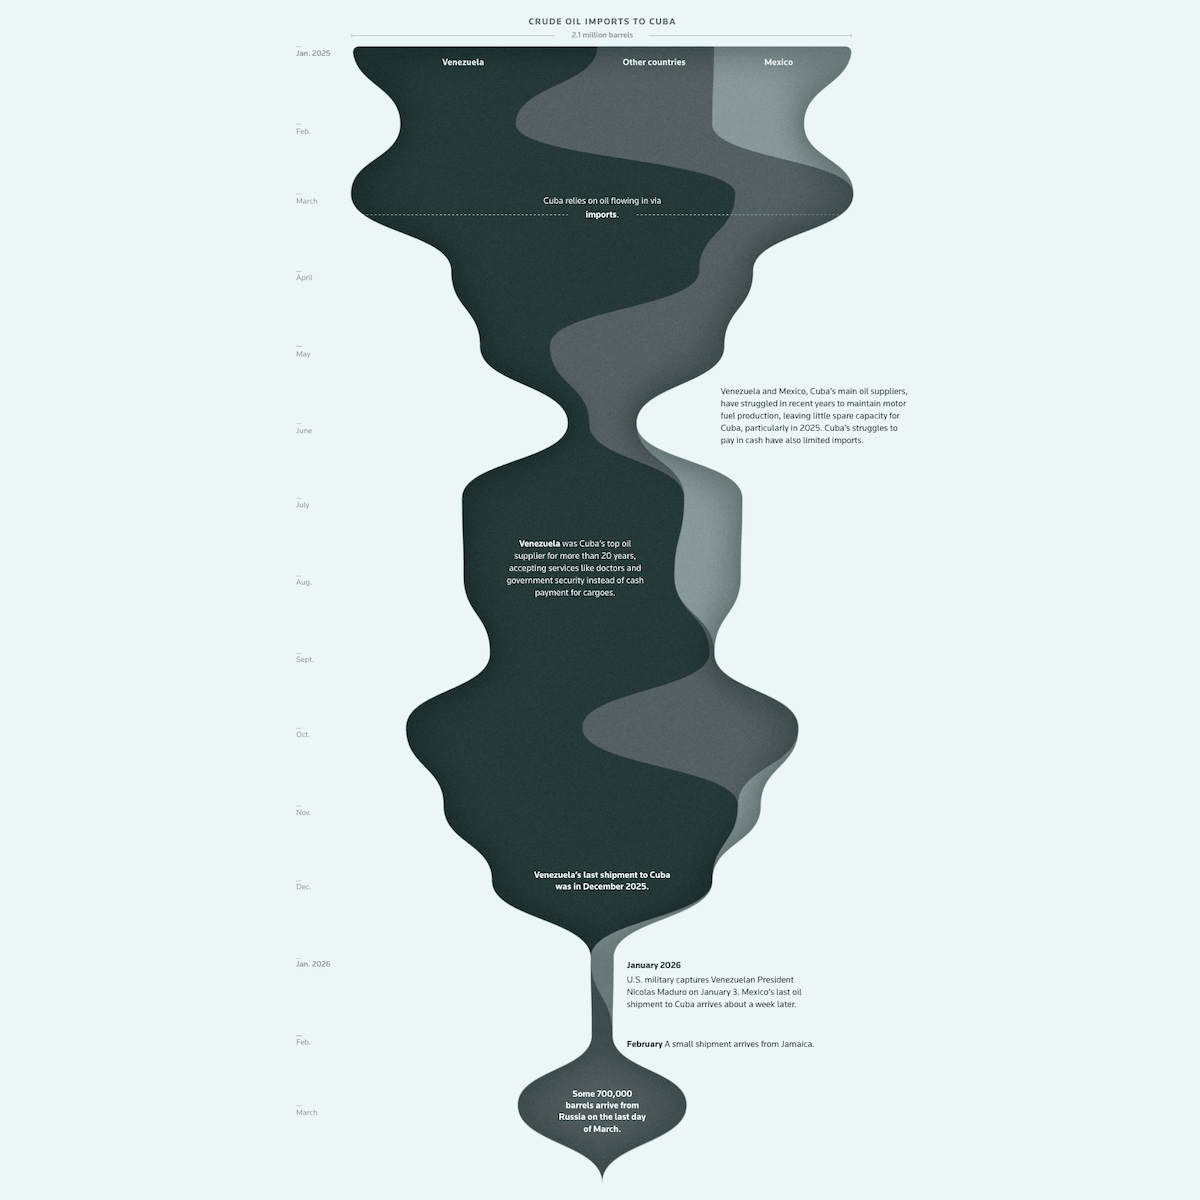
Cuba produces less than a third of the oil it needs and depends on imports for the rest. The loss of its two main suppliers has pushed the country into a severe energy crisis, with widespread blackouts affecting daily life.
Reuters built a data story around a stream graph tracing Cuba’s crude oil imports month by month from January 2025 through March 2026. Three bands represent Venezuela, Mexico, and other countries. The stream narrows dramatically as imports collapse, with annotated callouts marking key events: Venezuela’s final shipment in December 2025, Mexico’s exit in January 2026, and a small Russian delivery at the end of March amounting to just 7–10 days of supply under rationing.
Bar charts further into the piece show petroleum’s share of Cuba’s energy consumption compared to neighboring countries and the regional average, and break down oil use by sector.Check out the story on Reuters, by Ally J. Levine, Travis Hartman, Tiana McGee, and Marianna Parraga.
Family Business Succession Wave
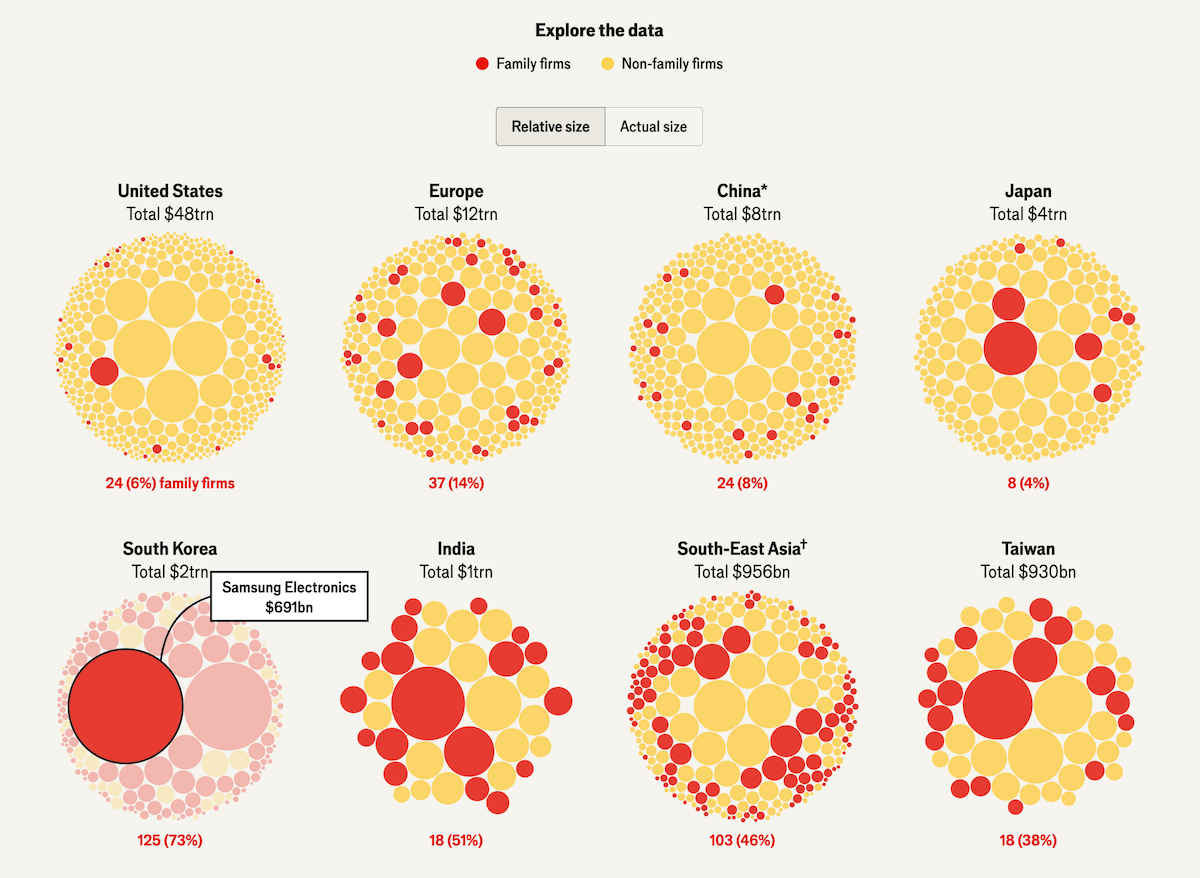
Family firms account for around two-thirds of all businesses worldwide and a similar share of global GDP. Many are now approaching a generational handover at the same time, as founding owners across the West and Asia reach retirement age.
The Economist uses circle packing charts to show the composition of large listed companies across major markets by ownership type, plotting each company as a bubble sized by market capitalization. Red marks family firms, yellow marks the rest.
The piece opens with a single pack of bubbles. As you scroll, the visual steps through regional breakdowns for the U.S. and Europe, followed by individual Asian markets. Each view makes the varying density of family ownership immediately visible across markets.
An interactive section then displays all eight markets at once. Hovering over any bubble identifies the company. A toggle switches between relative and actual size, shifting the picture from ownership share to raw market weight.
Look at the piece on The Economist.
Three Years of War in Sudan
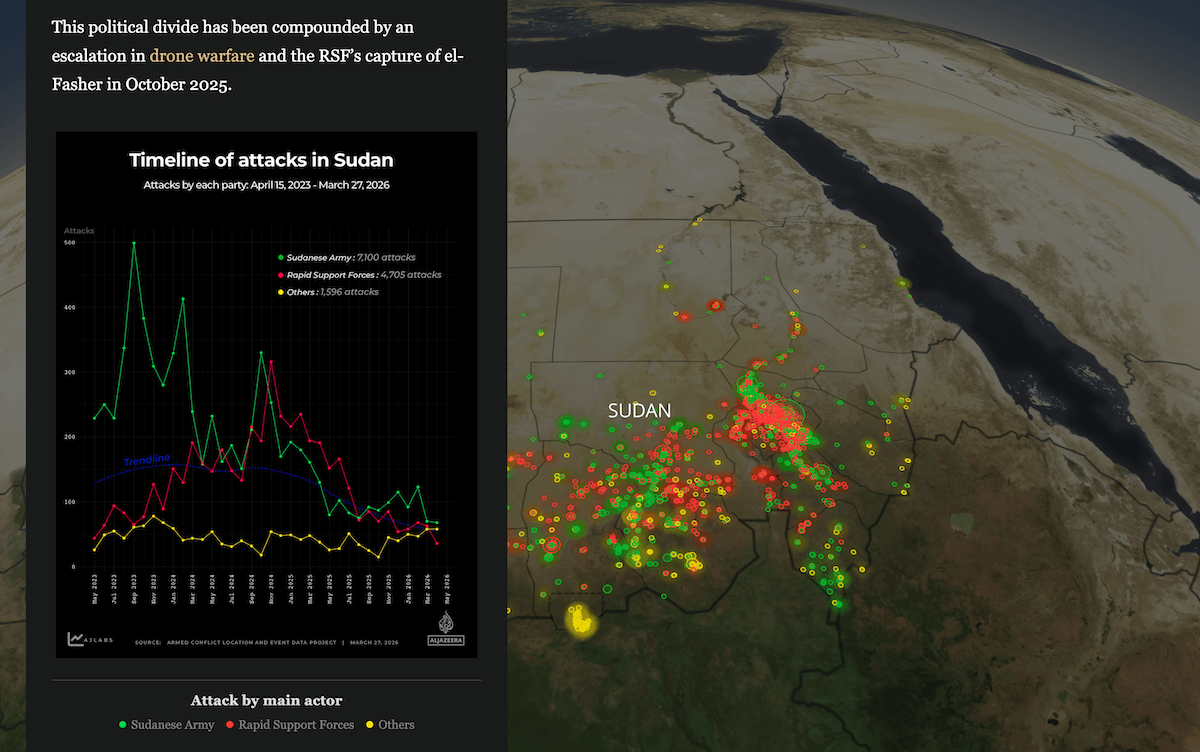
War broke out in Sudan on April 15, 2023, between the Sudanese Armed Forces and the paramilitary Rapid Support Forces. Three years on, more than 14 million people have been displaced and over 50,000 deaths recorded.
Al Jazeera built a scrollytelling piece anchored by a persistent dot map showing all 13,400+ recorded attacks across the country, color-coded by actor: green for the Sudanese Army, red for the RSF, and yellow for others. As the narrative scrolls through 10 of Sudan’s most heavily attacked regions, additional visuals appear on the left.
A dot map opens the piece with attack counts by region. A line chart traces the timeline of attacks by each party from 2023 through early 2026. Choropleth maps show how territorial control shifted — from the RSF’s early dominance across Darfur and the capital region to the army’s recovery of the east and center by April 2026.
Explore the story on Al Jazeera, by Mohamed A. Hussein and Amr Alkazaz.
Wrapping Up
This is what good data visualization looks like in practice — charts and maps that make complex subjects genuinely easier to understand. Check back next week for more great examples in Data Visualization Weekly.
- Categories: Data Visualization Weekly
- No Comments »