Qlik Extension Gets Gantt Chart and Tag Cloud in Version 2.5.0
November 6th, 2018 by AnyChart Team Following the 8.4.0 release of the AnyChart JS Charts library, now we’ve also got an awesome major update for our data visualization extension for Qlik Sense. Its version 2.5.0 is already available, adding Gantt Chart and Tag Cloud to the list of supported chart types.
Meet AnyChart Qlik Extension 2.5.0!
- Categories: AnyChart Charting Component, Qlik
- No Comments »
Data Visualization Weekly: Recent Popular Interesting Charts, Maps, and Infographics
March 3rd, 2017 by AnyChart Team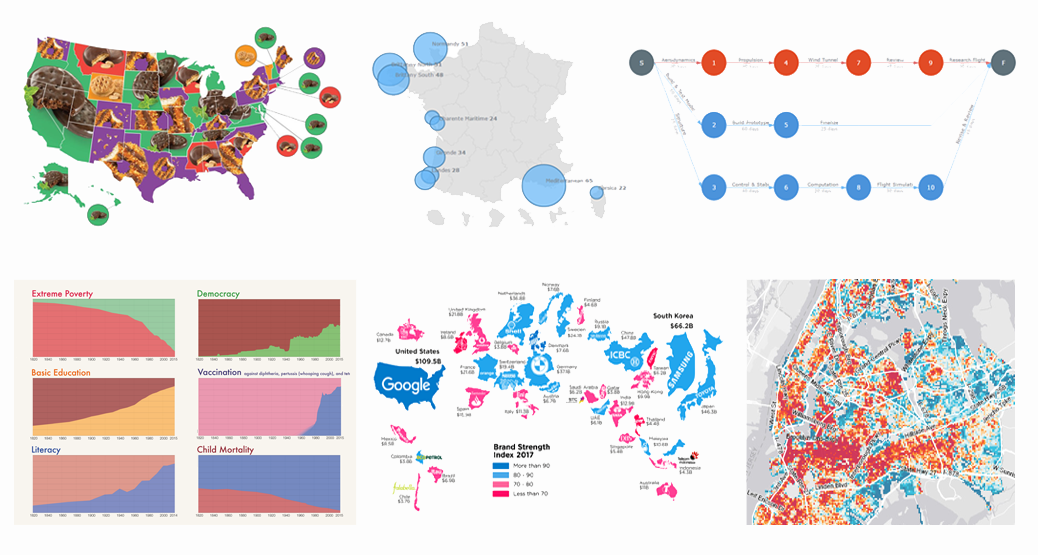 We are back with another collection of interesting charts, maps and infographics being popular lately. As you probably noticed, our Data Visualization Weekly series took a short break. In fact, no new issue came out last week. But the reason is simple and (hopefully) excusable. In fact, we were working really hard to get things done with the exciting major 7.13.0 update that our JavaScript charting libraries has received earlier this week.
Now the source code of AnyChart, AnyMap, AnyStock and AnyGantt is open. Plugins for all popular JS frameworks are available. And all the new features from the 7.13.0 release work great. That means we can finally get back to you to showcase new data visualizations that people followed most on our Twitter, Facebook and LinkedIn accounts over the last days. Moreover, the current issue of Data Visualization Weekly will cover the last two weeks instead of just one, to reimburse you for the delay. So, let’s take a look at the following great visual pieces now:
- Most Popular Girl Scout Cookies;
- History of Global Living Conditions in Interesting Charts;
- Interactive Map of Popular Surfing Areas in France;
- Most Popular Brands in Each Country;
- PERT Chart of Airplane Design Process;
- Revealing Age of Buildings in New York City.
- Categories: Charts and Art, Data Visualization Weekly, News
- No Comments »