New Data Visualization Projects Worth Checking Out — DataViz Weekly
July 19th, 2024 by AnyChart Team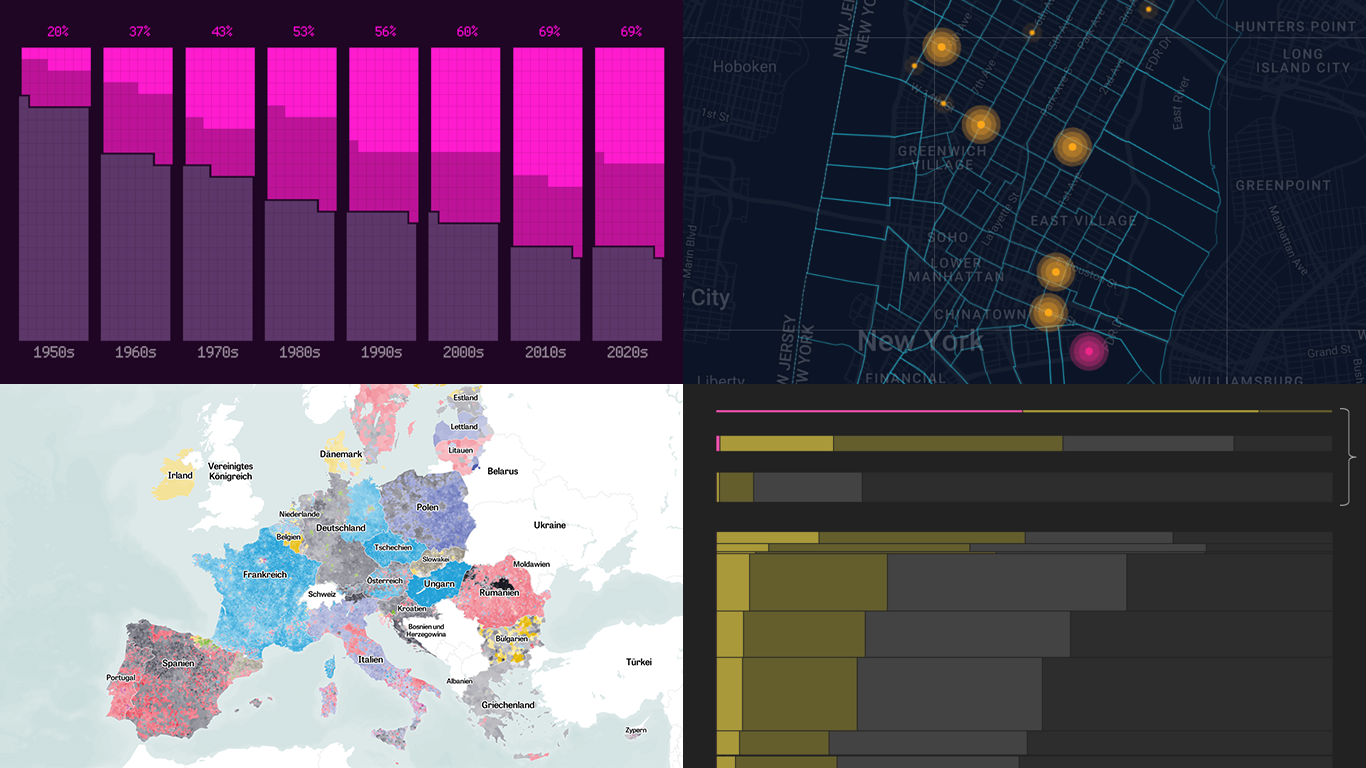 Data is easier to explore and analyze when visualized. If you’re looking for practical examples, you’ve arrived at the right place. DataViz Weekly is here to introduce you to some new data visualization projects we have found on the web.
- NYC congestion zone crash tracker — Transpo Maps
- 2024 European Parliament election map — ZEIT ONLINE
- Global hunger insights — Reuters
- Evolution of sci-fi films — The Pudding
- Categories: Data Visualization Weekly
- No Comments »
Revealing Insights with Data Visualizations — DataViz Weekly
June 14th, 2024 by AnyChart Team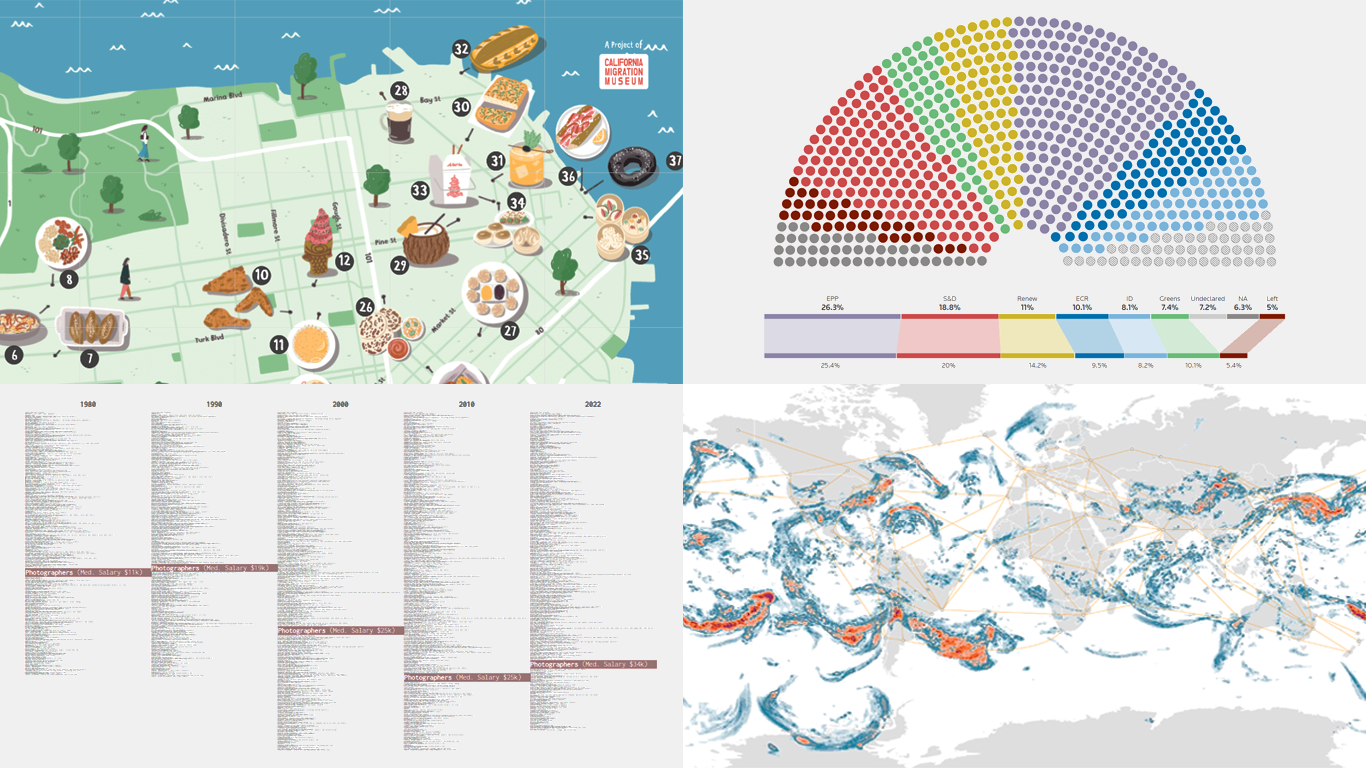 Data visualizations bridge the gap between raw numbers and clear, understandable insights. This week on DataViz Weekly, we showcase four remarkable new examples of how charts and maps illuminate diverse topics in a comprehensible and engaging manner:
- In-flight turbulence — South China Morning Post
- Shifts in occupation and income — FlowingData
- San Francisco’s culinary diversity — California Migration Museum
- EU election results — Reuters
- Categories: Data Visualization Weekly
- No Comments »
New Election Maps to Check Out — DataViz Weekly
October 14th, 2022 by AnyChart Team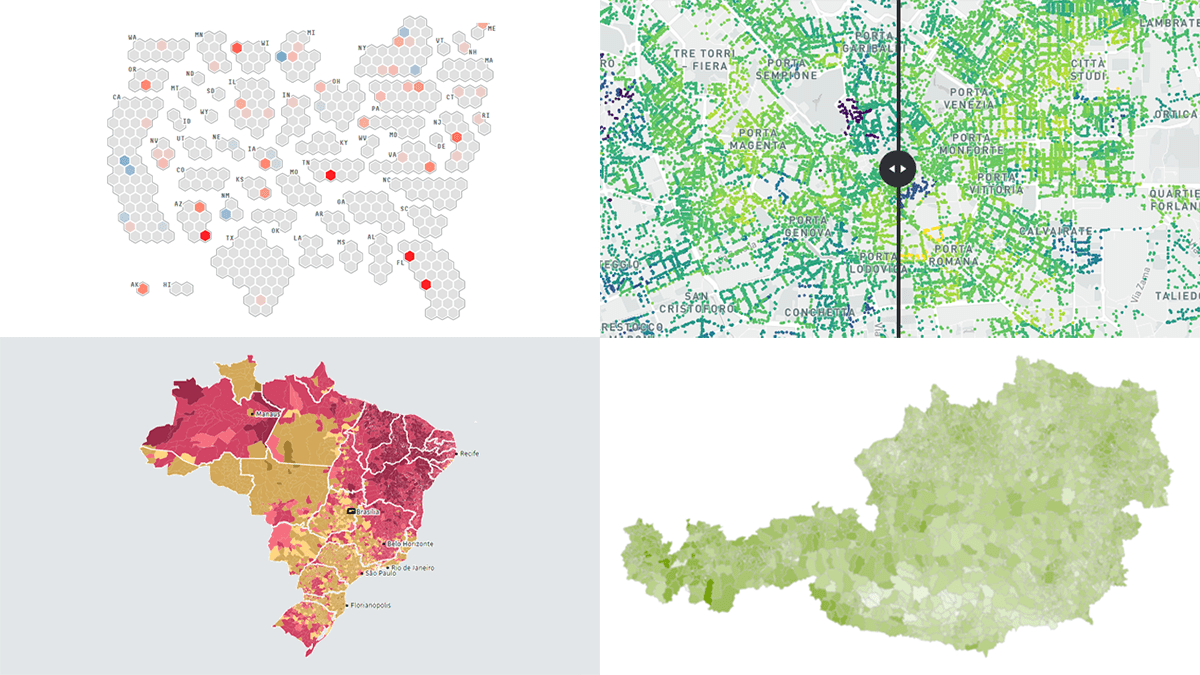 Some of the election races scheduled for this fall have already ended. Others are yet to be decided. And obviously now is a time for election maps to shine again! In this DataViz Weekly piece, we highlight a selection of maps visualizing data on the recent votes in Italy, Austria, and Brazil, as well as the upcoming midterm elections in the United States. Take a look.
- Categories: Data Visualization Weekly
- No Comments »
New Data Graphic Examples Worth Checking Out — DataViz Weekly
June 28th, 2019 by AnyChart Team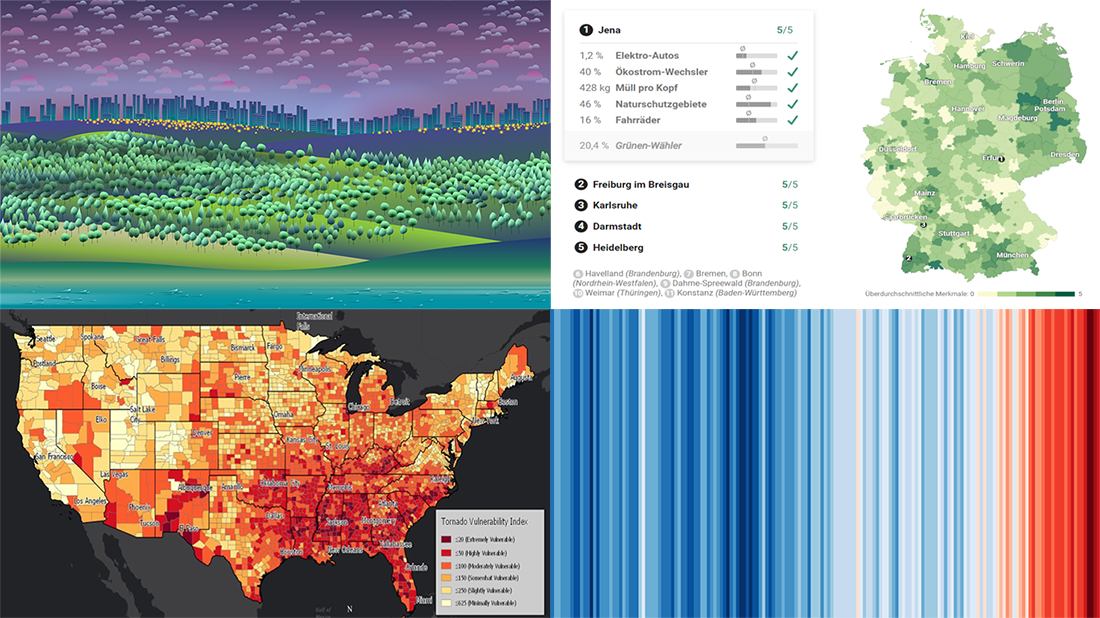 We’ve picked another four awesome projects as new data graphic examples to showcase in DataViz Weekly this Friday. Check them out right away as they are definitely worth it:
- Suicides in the Netherlands
- Where Germany is really green
- Temperature change worldwide
- Vulnerability to tornadoes across the United States of America
- Categories: Data Visualization Weekly
- 1 Comment »
Most Interesting Data Visualization: GBP, EU Election, MHW, Bob Ross — DataViz Weekly
June 7th, 2019 by AnyChart Team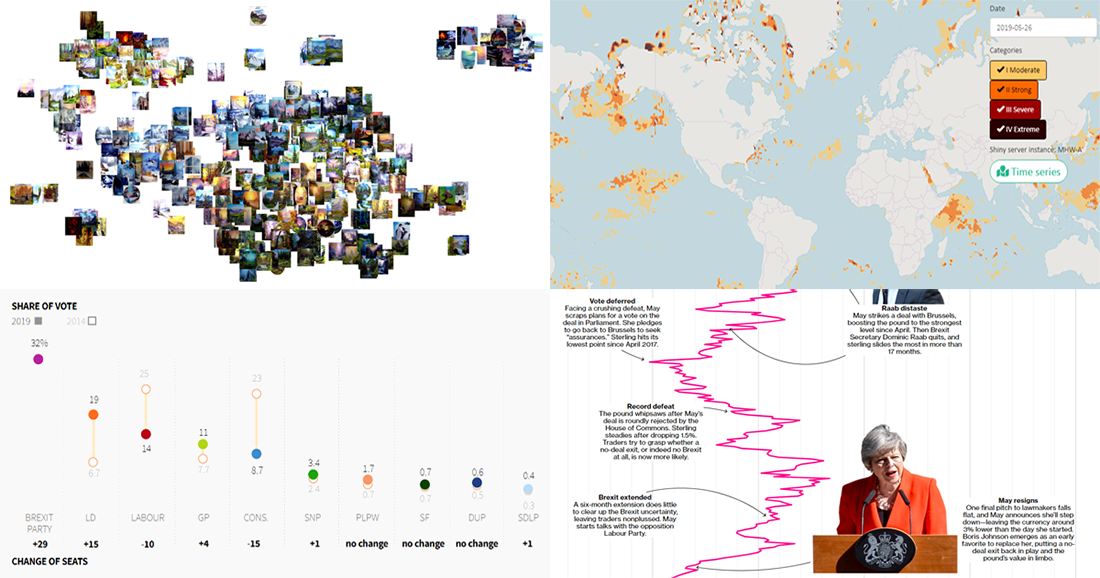 Take a look at four of the most interesting data visualization projects and stories we have found around the web during the last few days. Here’s what we feature today in DataViz Weekly:
- GBP rate change in the context of Brexit turns
- European Parliament election in the United Kingdom
- Marine Heatwave Tracker
- Evolution of Bob Ross’s famous phrases over all 403 episodes of The Joy of Painting
- Categories: Data Visualization Weekly
- No Comments »