AnyChart’s Co-Founder Timothy Loginov Named Top Creative Leader Innovating in Business 2019
June 24th, 2019 by AnyChart Team Business magazine Insights Success featured AnyChart‘s co-founder Timothy Loginov as one of the Top Creative Leaders Innovating in Business 2019! Today we are republishing an engaging two-page article that illuminates his journey from a freelance technical writer to a successful tech entrepreneur, outlines how our company has developed into a global leader in data visualization tools, and summarizes meaningful lessons and tips for emerging entrepreneurs.
- Categories: AnyChart Charting Component, News, Success Stories
- No Comments »
Best JavaScript Technology: AnyChart JS Charts Library Wins 2018 DEVIES Award!
February 6th, 2018 by AnyChart Team It’s happened! Our AnyChart JS Charts library has just been officially named the best in JavaScript Technology for innovation and received a prestigious DEVIES award in California! (See all the 2018 DEVIES winners — one for each of the 15 categories.)
2018 DEVIES is reported to be the world’s leading DevTech Awards event, taking place these days during DeveloperWeek in Oakland, CA, the largest developer expo and conference series globally.
- Categories: AnyChart Charting Component, AnyGantt, AnyMap, AnyStock, HTML5, JavaScript, News, Qlik, Success Stories
- 6 Comments »
Data Visualization with JavaScript: The Story of AnyChart JS Charts
September 7th, 2017 by AnyChart Team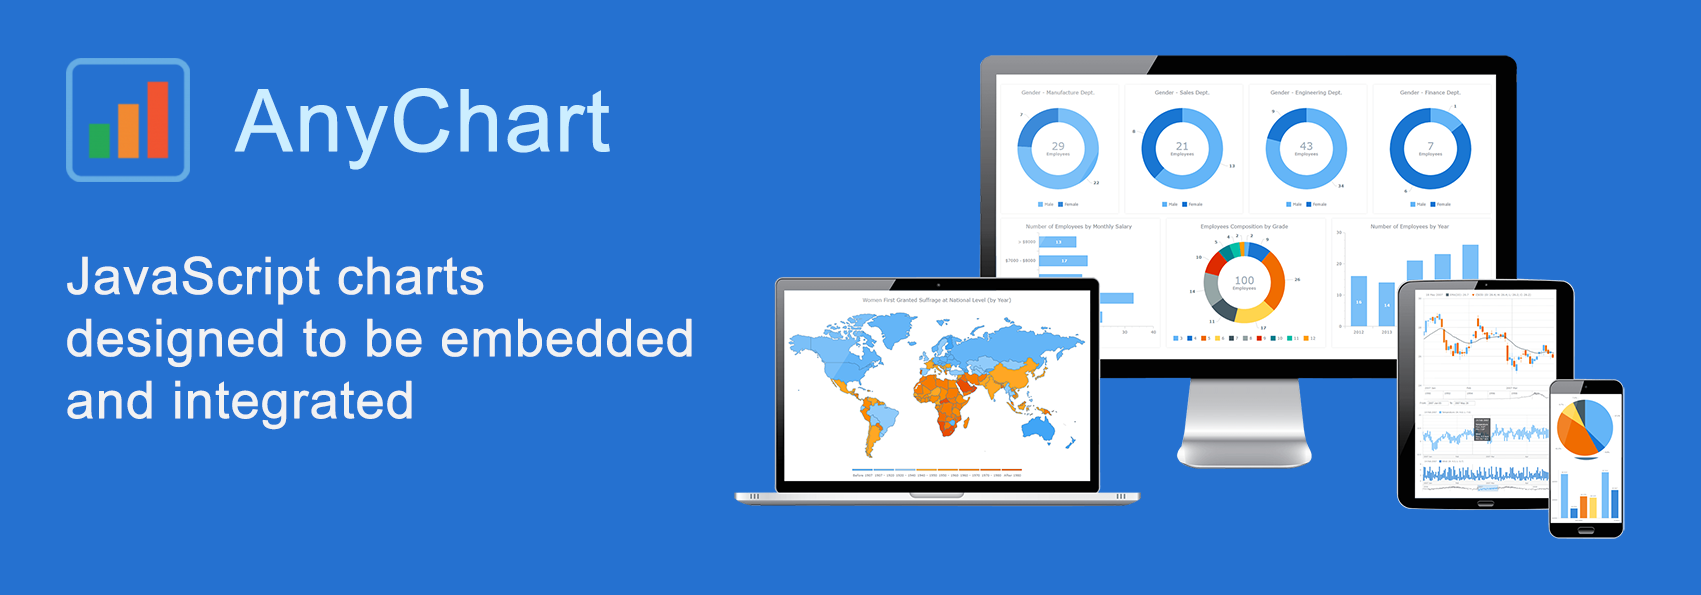 AnyChart is a flexible JavaScript (HTML5) based solution that allows you to create interactive and great looking charts. It is a cross-browser and cross-platform charting solution intended for everybody who deals with creation of dashboard, reporting, analytics, statistical, financial or any other data visualization solutions. AnyChart works everywhere -PCs, Macs, iPhones, iPads, Android devices and helps businesses transform operational data into actionable information.
Kevin William David interviewed Anton Baranchuk, CEO at AnyChart to know more.
- Categories: AnyChart Charting Component, AnyGantt, AnyMap, AnyStock, Business Intelligence, Flash Platform, GraphicsJS, HTML5, JavaScript, Oracle Apex, Qlik, Success Stories
- No Comments »
AnyChart Wins 2017 Devies Award for Best JavaScript Technologies (PHOTO)
February 14th, 2017 by AnyChart Team We are proud to tell you today that our company AnyChart has won the JavaScript Technologies category at the 2017 Devies Awards! The ceremony took place yesterday in San Francisco, CA, as part of DeveloperWeek, the world’s largest developer conference and expo with 8,000 attendees. Our CEO Anton Baranchuk received the award on behalf of the AnyChart team.
The DeveloperWeek Advisory Board received hundreds of nominations and, of course, thoroughly studied how much we did last year. What excited the judges most was the public release of our JavaScript graphics library GraphicsJS. And they concluded that to be last year’s most notable innovation in JavaScript technologies, exceptionally meaningful to the whole web development community.
The Devies Awards celebrate the most innovative companies in the field of developer technologies across 13 categories. Together with AnyChart, among this year’s winners are industry giants Microsoft and IBM.
- Categories: Charts and Art, GraphicsJS, JavaScript, News, Success Stories
- 5 Comments »
Sparks & Associates Chooses AnyChart to Visualize Assessment Results using JavaScript pie chart
July 3rd, 2015 by Margaret SkomorokhToday we are glad to publish a new customer success story – about AnyChart and Sparks & Associates.
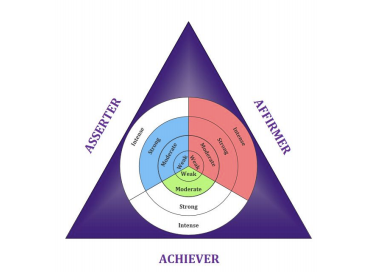
 The Actualized Leadership Profile (ALP) is a 77-item self assessment that measures an individual’s dominant motive need and corresponding style of leadership. Based on the seminal works of Abraham Maslow and David McClelland, the ALP measures the degree of self-actualization that is demonstrated in one’s current style of leadership. A customized, full color and confidential report identifies the strengths and limitations in the individual’s current leadership approach.
The challenge was:
- To provide a creative and intuitive visualization of personal assessment results.
- To create a visualization that accepts result parameters from the system’s existing ASP code.
Solution:
- AnyChart JavaScript (HTML5) component was chosen as a solution. The flexibility of the AnyChart.graphics technology allowed to nest several pie charts and create a multi-level JavaScript pie chart not available from other chart vendors.
- AnyChart provides the flexibility to use customized background visualizations.
You can enjoy the full success story here:
|
Sparks & Associates Sparks & Associates Chooses AnyChart to Visualize Assessment Results >> |
Or see other AnyChart Customer Success Stories.
- Categories: AnyChart Charting Component, HTML5, JavaScript, News, Success Stories
- No Comments »
DeviceLock Chooses AnyChart HTML5 charts for Its DLP Security Solution
June 11th, 2015 by Margaret SkomorokhWe are happy to announce that a new customer success story has been added to our site.
 DeviceLock, Inc, established in 1996, is a leading provider of endpoint device/port control and data leak prevention software for business, education and government institutions around the world. The company offers DeviceLock, a policy-based endpoint data leak prevention (DLP) security solution that enables network administrators to centrally control uploading and downloading activity through local computer devices and network protocols and applications.
The challenge was:
- To present the activity of DeviceLock in a clear and visually appealing way.
- To make complex data easy to read and understand so that the situation could be quickly evaluated by the end user.
Solution:
- AnyChart JavaScript charts were chosen as a solution. The component allows to create stylish interactive HTML5 charts and provides excellent rendering performance.
- Due to wide variety of chart types and the flexibility of AnyChart, it was possible to implement user-friendly data visualizations.
You can enjoy the full success story here:
|
DeviceLock DeviceLock Chooses AnyChart for Its DLP Security Solution >> |
Or see other AnyChart Customer Success Stories.
- Categories: AnyChart Charting Component, Business Intelligence, HTML5, JavaScript, Success Stories
- No Comments »
New Partnership Announcement: Datonix and AnyChart
May 22nd, 2015 by Margaret SkomorokhWe are very pleased to announce that AnyChart have partnered with Datonix.
Datonix primary product is datonixOne, a computer appliance designed for BIGDATA Solutions and eXpress development. Using datonixOne, Federated BIGDATA applications can be quickly developed, providing ready information for end users.
AnyChart partners: https://www.anychart.com/partners/.
- Categories: AnyChart Charting Component, Success Stories, Third-Party Developers, Uncategorized
- No Comments »
Spread Co Chooses AnyStock for Its Online Trading Platform
September 26th, 2012 by Margaret SkomorokhToday we are glad to publish a new customer success story – about AnyStock and Spread Co.
![]() Spread Co, founded in 2006, is one of the leading providers of Contracts for Difference and Spread Trading in the UK, with partnerships in a number of locations worldwide, including Central and Eastern Europe, Scandinavia, the UAE and South America. The company offers three trading platforms: a downloadable desktop platform Saturn Trader, Saturn Mobile for iPhone, and Saturn Web for online trading.
Spread Co, founded in 2006, is one of the leading providers of Contracts for Difference and Spread Trading in the UK, with partnerships in a number of locations worldwide, including Central and Eastern Europe, Scandinavia, the UAE and South America. The company offers three trading platforms: a downloadable desktop platform Saturn Trader, Saturn Mobile for iPhone, and Saturn Web for online trading.
The challenge was:
- To find a reliable and fast Flash-based charting solution that could be controlled from a JavaScript API in order to implement a visualization for Saturn Web – an online multi-asset trading platform supporting Foreign Exchange, CFD Trading and Spread Betting.
- To provide tools for technical analysis, the ability to add annotations and draw on charts.
Solution:
- The AnyChart Stock component was chosen as a solution, having an extensive JavaScript API and great opportunities for customization. The component comes with a special JavaScript library that controls all the aspects of the interaction between the chart, the HTML page, and the server.
- AnyStock supports annotations, a complete list of drawing tools, and 30 automatically calculated technical indicators and overlays.
You can enjoy the full success story here:
| Spread CoSpread Co Chooses AnyStock for Its Online Trading Platform >> |
Or see other AnyChart Customers Success Stories.
- Categories: AnyChart Charting Component, Success Stories
- No Comments »
Extravision Chooses AnyChart to Display Email Reporting Statistics
July 2nd, 2012 by Margaret SkomorokhThe numerous industries where AnyChart was applied includes the Email Marketing industry, and today we are publishing a success story about this case.
![]() Extravision, founded in 2004, is a privately owned UK-based email service provider that offers flexible email marketing solutions to both small and large businesses across all sectors. Its products include Extravision Messenger, which enables users to create and send email marketing campaigns, and Extravision Reports — a tool designed to assess the ROI and effectiveness of email campaigns sent via Extravision Messenger.
Extravision, founded in 2004, is a privately owned UK-based email service provider that offers flexible email marketing solutions to both small and large businesses across all sectors. Its products include Extravision Messenger, which enables users to create and send email marketing campaigns, and Extravision Reports — a tool designed to assess the ROI and effectiveness of email campaigns sent via Extravision Messenger.
The challenge was:
- To enhance the display of the top email reporting statistics within Extravision Reports.
- To create a style that is easy for users to interpret and digest.
- To visualize different types of data: opens, clicks, and unsubscribe percentages as well as some time-based metrics.
Solution:
- AnyChart was chosen to visualize the statistics due to its flexibility and opportunity to create visually appealing and readable charts.
- AnyChart has all the features needed to easily configure charts and customize the style.
- Opens, clicks and unsubscribes were displayed in a pie chart format which allows users to see in an instant the success of their email campaigns. Line charts were used to display time-based data.
You can enjoy the full success story here:
| ExtravisionExtravision Chooses AnyChart to Display Email Reporting Statistics >> |
Or see other AnyChart Customers Success Stories.
- Categories: AnyChart Charting Component, Success Stories
- No Comments »
NERRS Centralized Data Management Office Chooses AnyChart to Visualize Water Quality and Weather Data
June 29th, 2012 by Margaret SkomorokhWe are glad to present a new customer success story that demonstrates how AnyChart was used to visualize water quality and weather data.
![]() The National Estuarine Research Reserve System (NERRS) is a partnership program between the U.S. National Oceanic and Atmospheric Administration and the coastal states, established in 1972. It encompasses a network of 28 areas representing different biogeographic regions of the United States that are protected for research, education, and stewardship. Quantitative measurements within the program concern both short-term variability and long-term changes in the water quality and weather of estuarine ecosystems. The NERRS Centralized Data Management Office is charged with managing and disseminating these data.
The National Estuarine Research Reserve System (NERRS) is a partnership program between the U.S. National Oceanic and Atmospheric Administration and the coastal states, established in 1972. It encompasses a network of 28 areas representing different biogeographic regions of the United States that are protected for research, education, and stewardship. Quantitative measurements within the program concern both short-term variability and long-term changes in the water quality and weather of estuarine ecosystems. The NERRS Centralized Data Management Office is charged with managing and disseminating these data.
The challenge was:
- To provide graphs of near real-time water quality and weather data that is transmitted hourly from National Estuarine Research Reserves across the United States.
- To allow users, which vary from local fishermen to research scientists, a quick and clean way to view data from one or multiple parameters (such as air temperature, wind direction, salinity, etc.) for the past 24 hours.
The solution consisted in the following:
- AnyChart’s charting technology was chosen as a solution. Data from an SQL database is converted to the XML format by ColdFusion and passed to the Flex version of AnyChart component, which is an easy and quick way to update the graphs.
- AnyChart’s ample opportunities for customization were used to create comprehensible and clear interactive visualizations.
This visualization is publicly available through the NERRS Centralized Data Management Office Real Time Data Application
You can enjoy the full success story here:
| The National Estuarine Research Reserve System’s Centralized Data Management OfficeNERRS Centralized Data Management Office Chooses AnyChart to Visualize Water Quality and Weather Data >> |
Or see other AnyChart Customers Success Stories.
- Categories: AnyChart Charting Component, Success Stories
- No Comments »