Data Design Advices by Edward Tufte
June 21st, 2011 by Margaret SkomorokhEdward Rolf Tufte is an American statistician and professor emeritus of political science, statistics, and computer science at Yale University. He is noted for his writings on information design and as a pioneer in the field of data visualization. Here is his website: http://www.edwardtufte.com/tufte/.
We appreciate his works very much, especially The Visual Display Of Quantitative Information, which we recommend to any developers or designers.
As it says,
Graphical displays should
- show the data
- induce the viewer to think about the substance rather than about methodology, graphic design, the technology of graphic production, or something else
- avoid distorting what the data have to say
- present many numbers in a small space
- make large data sets coherent
- encourage the eye to compare different pieces of data
- reveal the data at several levels of detail, from a broad overview to the fine structure
- serve a reasonably clear purpose: description, exploration, tabulation, or decoration
- be closely integrated with the statistical and verbal descriptions of a data set.
AnyChart is an instrument. We give the opportunity to create many different charts in many different ways, and this powerful instrument should be used correctly.
Speaking of “encouraging the eye to compare different pieces of data”: compare a table and a graphical representation of the famous Anscombe’s Quartet:
| I | II | III | IV | ||||
|---|---|---|---|---|---|---|---|
| x | y | x | y | x | y | x | y |
| 10.0 | 8.04 | 10.0 | 9.14 | 10.0 | 7.46 | 8.0 | 6.58 |
| 8.0 | 6.95 | 8.0 | 8.14 | 8.0 | 6.77 | 8.0 | 5.76 |
| 13.0 | 7.58 | 13.0 | 8.74 | 13.0 | 12.74 | 8.0 | 7.71 |
| 9.0 | 8.81 | 9.0 | 8.77 | 9.0 | 7.11 | 8.0 | 8.84 |
| 11.0 | 8.33 | 11.0 | 9.26 | 11.0 | 7.81 | 8.0 | 8.47 |
| 14.0 | 9.96 | 14.0 | 8.10 | 14.0 | 8.84 | 8.0 | 7.04 |
| 6.0 | 7.24 | 6.0 | 6.13 | 6.0 | 6.08 | 8.0 | 5.25 |
| 4.0 | 4.26 | 4.0 | 3.10 | 4.0 | 5.39 | 19.0 | 12.50 |
| 12.0 | 10.84 | 12.0 | 9.13 | 12.0 | 8.15 | 8.0 | 5.56 |
| 7.0 | 4.82 | 7.0 | 7.26 | 7.0 | 6.42 | 8.0 | 7.91 |
| 5.0 | 5.68 | 5.0 | 4.74 | 5.0 | 5.73 | 8.0 | 6.89 |

As you can see, in this case the graphical representation speaks loudly, whilst the table remains silent.
We will go on posting here some important tips from Edward Tufte’s books, but after all, the most helpful thing is just considering carefully the way to visualize your data.
- Categories: AnyChart Charting Component, Tips and Tricks
- No Comments »
Auditr Chooses AnyChart to Visualize Healthcare Data
June 15th, 2011 by Timothy LoginovToday, we are glad to publish a new success story: Auditr have chosen AnyChart to visualize healthcare data.
Auditr (http://www.auditr.com/) is an online, totally web-based service designed specially for hospitals and healthcare organizations. It helps to provide assurance, get early warning of potential problems, and improve performance. With Auditr, users can collect data, report and discuss the results, develop and monitor action plans. Auditr is developed by Internet Learning Ltd, a company that previously built learning management systems used in the field of healthcare.
The challenge was to visualize time-based and statistical data for reports in the form of line, bar, meters and heatmap charts and to make the charts interactive so that an end-user could proceed to more detailed information by clicking a particular point of a chart.
AnyChart was chosen as a solution – the component allows creating a wide variety of fully configurable charts, and all data is easily set in XML format. Using AnyChart’s interactivity options, actions that should be performed when a user clicks a point on a chart were defined.
Enjoy the full story:
| Auditr Auditr Chooses AnyCart to Visualize Healthcare Data >> |
Other stories can be found at: https://www.anychart.com/company/success_stories.php
- Categories: AnyChart Charting Component, Success Stories
- No Comments »
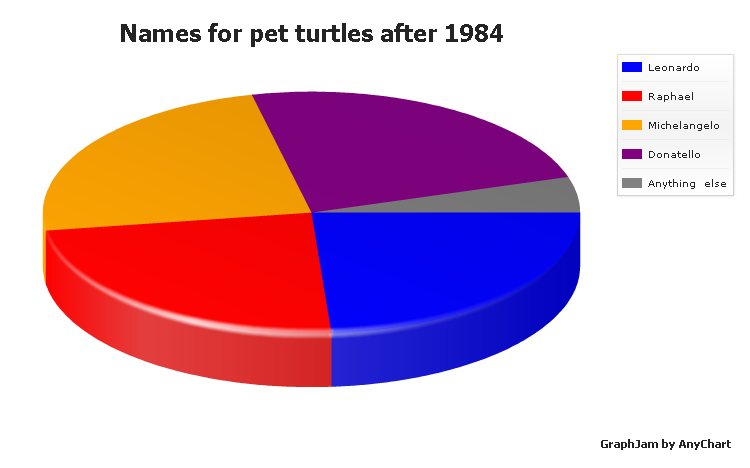
AnyChart GraphJam: Ninja Turtles 3D Pie Chart
June 9th, 2011 by Margaret SkomorokhCharts make people not only understand numbers, but also laugh.
GraphJam is a website showing music and popular culture in funny charts and graphs created by users. These charts can be viewed as a form of modern Internet folklore – signed by nicknames, they are half anonymous, and most witty ones are often reposted by other users in blogs and social networks, which resembles the way folklore spreads.
The fact that charts can be used in such an unexpected and curious way truly inspires us. And it was difficult to stay aside, not trying to apply here AnyChart’s vast capabilities and make some especially interesting items posted at GraphJam even more expressive.
All our charts are fully configurable and nice-looking, so they show the best advantage of any information, including even jokes. One of the many types supported by AnyChart is a 3D Pie Chart, and this is our version of a GraphJam 3D Pie Chart:
To check out other examples of Pie and Donut Charts, visit our gallery.
We will be posting more charts from GraphJam created by AnyChart.
- Categories: AnyChart Charting Component
- No Comments »
Xlinesoft.com Chooses AnyChart for Its Web Authoring Tools
April 19th, 2011 by Margaret SkomorokhA new success story that we are glad to post here is about a company from the Software Development industry.
Xlinesoft.com is a software development group. It focuses on providing innovative, powerful yet easy-to-use Internet-related software products that are designed for helping users to make Web authoring easy. With Xlinesoft tools, thousands of people can quickly design online applications.
The ability to display charts is critical for any modern rich Internet application, so most users were demanding modules making possible to visualize data from their databases as charts.
AnyChart charting modules were an excellent solution, because the work of the component doesn’t depend on server-side support, which makes it compatible with different kinds of apllications and allows to lower development and licensing costs. Users are pleased with perfect design, usability and multiple configuration options of AnyChart charts.
You can enjoy the success story here:
| XlinesoftXlinesoft.com Chooses AnyChart for Its Web Authoring Tools >> |
Other stories can be found here: https://www.anychart.com/company/success_stories.php
- Categories: AnyChart Charting Component, Success Stories
- No Comments »
Oleg Patsianskiy Chooses AnyChart for His Consulting Needs
April 4th, 2011 by Margaret SkomorokhThe success story we are presenting today is about Oleg Patsianskiy – an independent strategic consultant assisting various holding and trust companies all over the world.
The challenge was to develop personal multi-purpose BPDs (Business Performance Dashboards) working in real time for combined financial and operational data. AnyChart proved to be the best solution, which provides analytics on the fly and allows easy customization of the output.
“AnyChart products are way beyond any other charting solutions available on the market due to its flexible XML input customization and AJAX-based interactivity,” Oleg Patsianskiy said.
You can read this success story here: Oleg Patsianskiy chooses AnyChart for his consulting needs >>
Other stories: https://www.anychart.com/company/success_stories.php
- Categories: AnyChart Charting Component, Success Stories
- No Comments »
Rockford Corp. Chooses AnyChart Solution
March 30th, 2011 by Margaret SkomorokhIt is great to have a lot of different clients in various industries. Today we publish another success story, this time about a company from the Electronic Equipment industry.
Rockford Corporation manufactures audio electronics, speakers & accessories. Since 1973, the company provides outstanding mobile audio solutions. It has also designed the industry’s first online woofer enclosure recommendation and modeling application called the RFTECH:Woofer BoxAdvisor, which allows to plot either theoretical or real in-car acoustical transfer functions.
The application uses AnyChart extensively. According to Eric Russell, WebWizard and Technical Writer for Rockford Fosgate, RFTECH:Woofer BoxAdvisor “is very functional due to AnyChart’s dynamic flash charts and gauges with real-time updating.”
You can enjoy the success story here:
| Rockford Corp.Rockford Corp. Chooses AnyChart Solution for Industry’s First Online Woofer Modeling Application >> |
Other stories can be found here: https://www.anychart.com/company/success_stories.php
More coming soon!
- Categories: AnyChart Charting Component, Success Stories
- No Comments »
HTML5 Version of AnyChart Coming Soon
March 24th, 2011 by Timothy Loginov![]()
With the increasing popularity of iOS devices gaining traction in the marketplace, AnyChart is proud to announce the upcoming release of AnyChart HTML5. The new version is planned for release in May of 2011. A private Beta will be distributed in April.
A demo version can be found here: https://www.anychart.com/html5/demo/
You can also take a look at a demo video, showing AnyChart at iPad:
A short Q & A with our HTML5 Lead developer Alex Batsuev:
- Categories: AnyChart Charting Component
- No Comments »
Knowledgebase Updates
February 16th, 2011 by Margaret SkomorokhDon’t forget that we have a knowledgebase: https://www.anychart.com/kb
We have already written about it before: https://www.anychart.com/blog/2009/06/30/anychart-knowledge-base
We do our best to update it as and when necessary and recently have added a few articles:
AnyChart
- How to display all axis labels?
- Is it possible to refresh chart every X seconds?
- How to insert point custom attributes when data is in JSON format?
AnyGantt
We want to note that this problem: Documentation doesn’t display properly in Internet Explorer 7 and later has lost relevance in AnyChart 5.1.2.5
P.S. We are very pleased that our customers often find a minute to thank us and we have eventually added a testimonials page: https://www.anychart.com/company/testimonials.php
Thanks to everybody who has spoken out or not.
- Categories: AnyChart Charting Component, AnyGantt
- No Comments »
AnyChart 5.1.2.5 Update
January 27th, 2011 by Timothy LoginovOn 26th of February AnyChart is proud to release version 5.1.2.5 of AnyChart Flash Charting Component with new JavaScript library methods, enhanced pie and donut charts labeling algorithm, extended external scroll interface and a lot of bugfixes. Please download the latest trial version from AnyChart Download Section.
- New: Chart Show and Hide methods
- Improvement: Pie labeling mechanism improved
- Improvement: JS Scroll interface extended
- Bug fix: JavaScript data manipulation and loosing changes
- Bug fix: “No data” message in Funnel and Treemap
- Bug fix: Memory Leaks in IE
- Bug fix: Point click in Pie charts return value
- Bug fix: Absolute Deviation threshold issues
- Bug fix: Pies and palettes
- Bug fix: Scroll behavior
- Bug fix: Tooltip cut off
- Bug fix: Logarithmic axis labeling
- Bug fix: AM/PM Date Time issue
- Bug fix: Negative values labeling
We hope you enjoy all these improvements and we’ll do our utmost to make AnyChart even better in future releases.
- Categories: AnyChart Charting Component
- No Comments »
Improved Charting in Oracle APEX
June 24th, 2010 by Margaret SkomorokhNew version of Oracle APEX is available. A lot of new features >>
And… Improved Charting with Gantts and Maps
“The underlying charting engine has been upgraded to AnyChart 5.1 which is faster, provides better graphics, and decreases rendering time. Developers can take advantage of the many additional attributes to readily customize the appearance of their charts. Declarative support for project and resource Gantt charts together with flash Maps has also been incorporated.”
To view the new features in action, run the demonstration application.
- Categories: AnyChart Charting Component, AnyGantt
- No Comments »