How to Create Stacked Chart with JavaScript
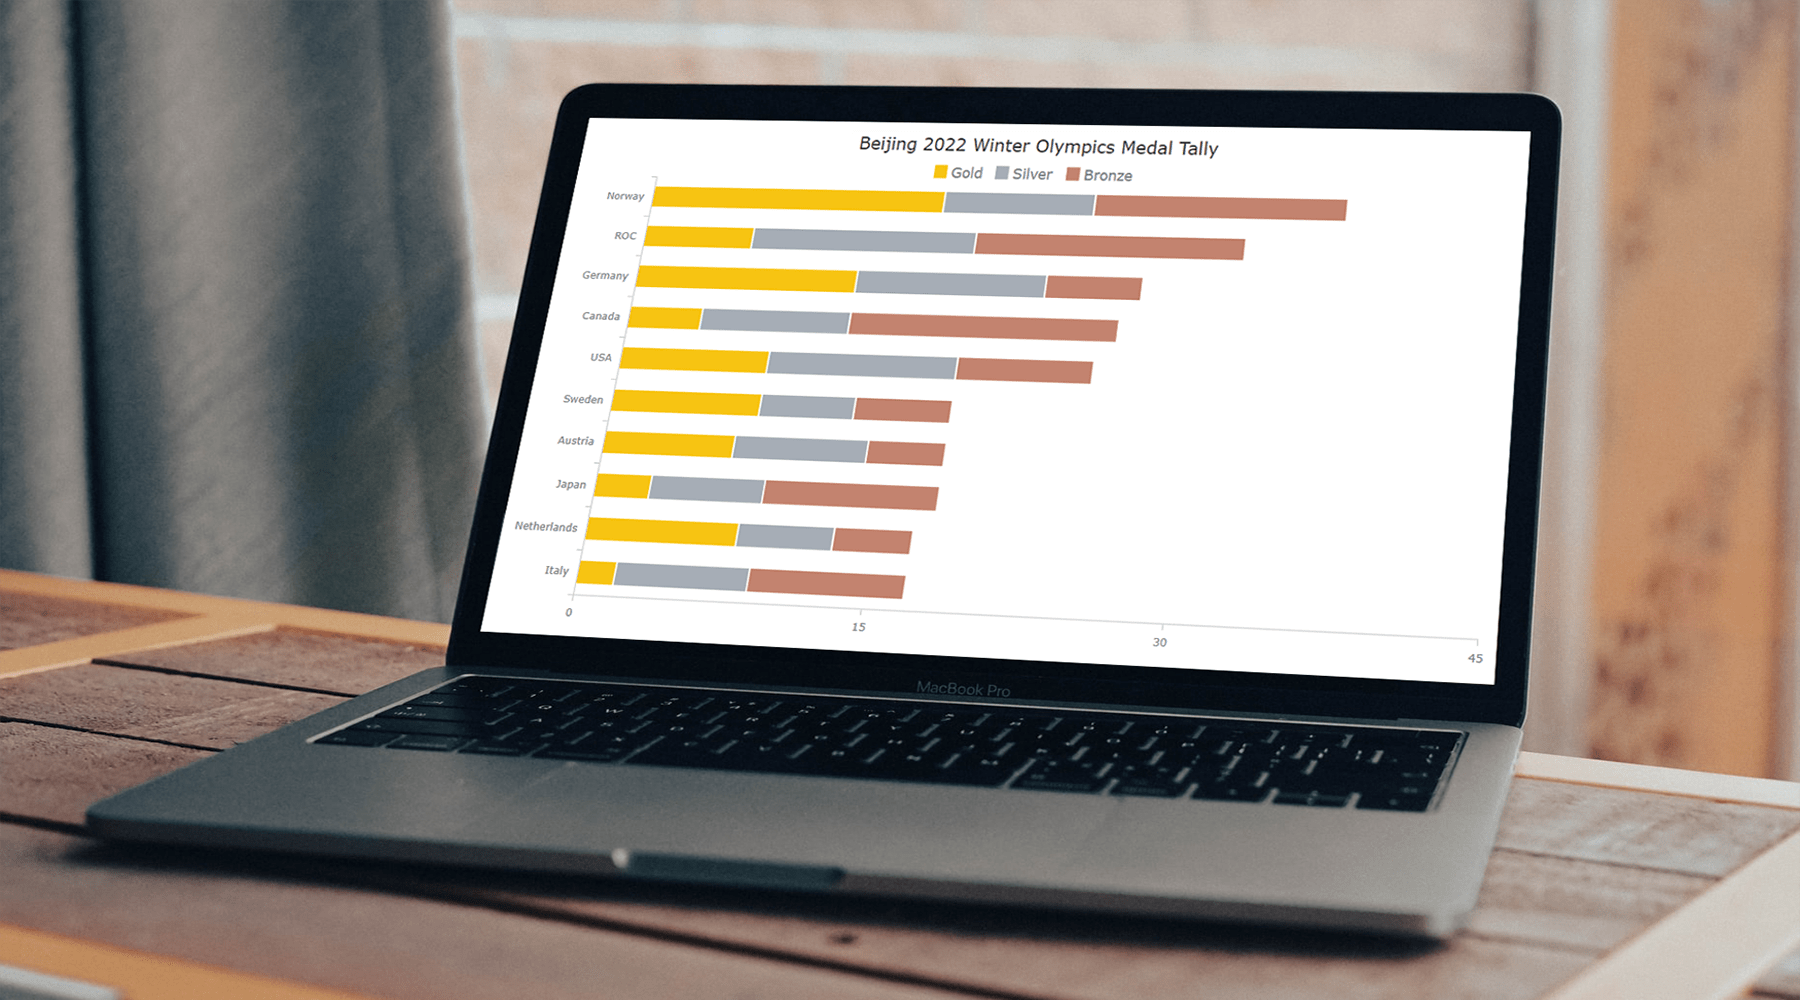
April 12th, 2022 by Shachee Swadia Data visualization is a skill vital for analysts and developers in the current times. Stacked charts are one of the most widely used chart types, and now I want to tell you what they are and how to build such graphics with ease using JavaScript. In the main tutorial part, I will be creating different versions of a stacked chart, providing comprehensive step-by-step instructions to let you learn fast. My visualizations will offer a look at the medal counts for the top 10 countries on the final Beijing 2022 Winter Olympics leaderboard so you also have fun as you follow along.
Read the JS charting tutorial »
- Categories: AnyChart Charting Component, HTML5, JavaScript, JavaScript Chart Tutorials, Tips and Tricks
- No Comments »