Meet AnyChart at Qlik Connect 2025: Booth #1007 — Plus Chances to Win Apple Prizes!
April 30th, 2025 by AnyChart Team Qlik Connect 2025 is coming up fast, and we at AnyChart are excited to return as a sponsor and exhibitor after last year’s success! Mark your calendar for May 13–15 and join us at Disney’s Coronado Springs Resort in Lake Buena Vista, Florida.
Be sure to stop by Booth #1007 to explore the latest in our suite of Qlik Sense extensions. Discover Excel-like Spreadsheets for Qlik, see what’s new and upcoming in other tools, and enter our contests for a chance to win premium Apple prizes — including a MacBook, Apple Watch, iPad, and more!
Read more at qlik.anychart.com »
- Categories: AnyChart Charting Component, Big Data, Business Intelligence, Dashboards, News, Qlik
- No Comments »
Gantt Chart Legend — JS Chart Tips
November 21st, 2024 by AnyChart Team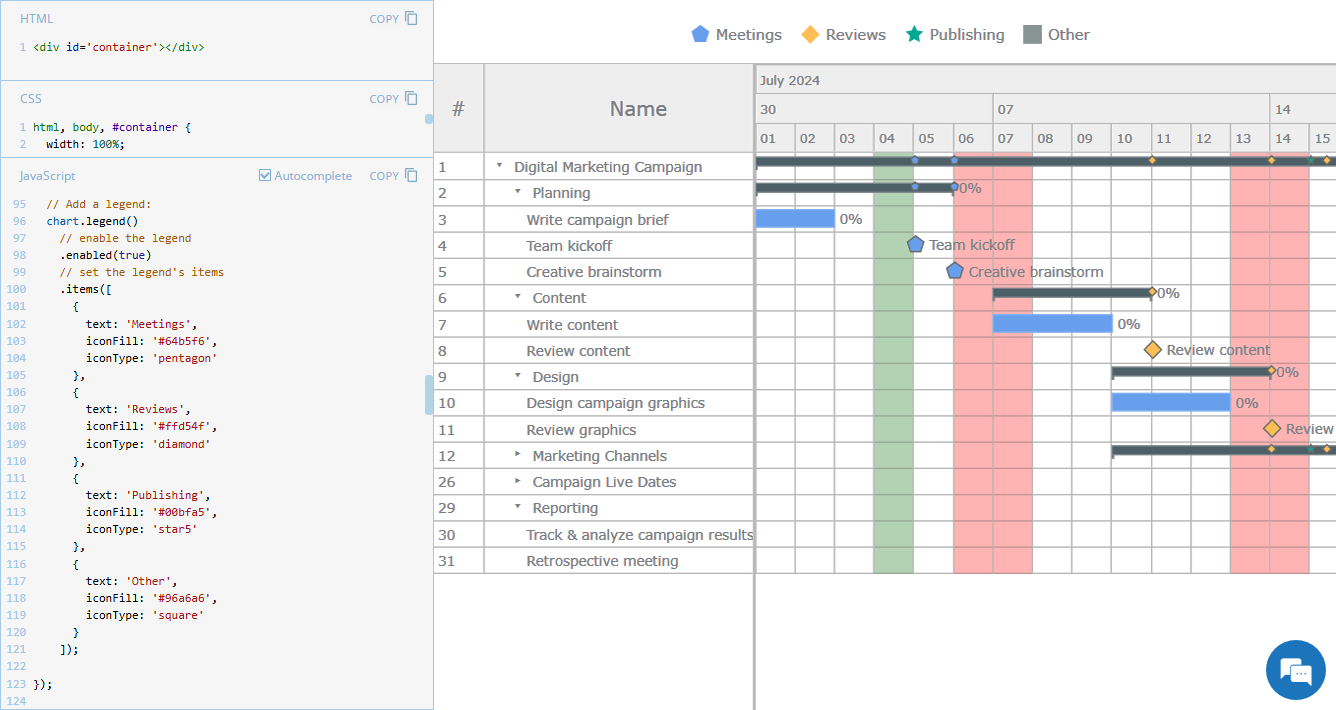 Legend is a vital element in many charts, helping viewers quickly understand what each visual component represents. However, it is not always a must-have for every chart type. For instance, Gantt charts often work perfectly fine without a legend, so it is not enabled in our JavaScript Gantt Chart by default. That said, creating one is straightforward. Right now, we will show you how to add a legend to a Gantt chart — join us as we continue our JS Chart Tips series, sharing quick solutions inspired by real customer queries!
- Categories: AnyChart Charting Component, AnyGantt, Business Intelligence, Gantt Chart, HTML5, JavaScript, JS Chart Tips, Tips and Tricks
- 2 Comments »
JavaScript Gantt Chart with Custom Data Grid Header Font — JS Chart Tips
August 20th, 2024 by AnyChart Team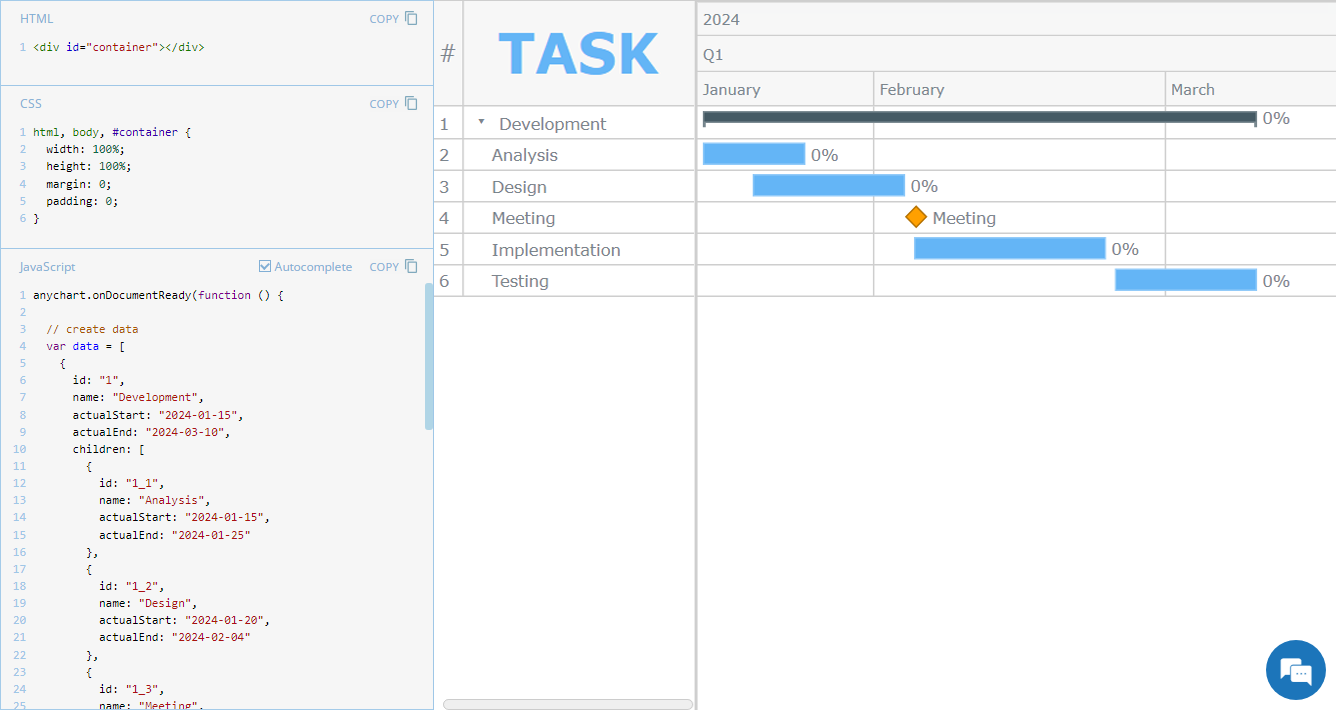 Hey everyone! We’re excited to launch a new regular feature on our blog called JS Chart Tips. In this series, we’ll share some recent cases handled by our Support Team for users of our JavaScript charting library, highlighting both frequent questions and those unique solutions that shouldn’t remain hidden.
Whether these scenarios directly resonate with a challenge you’re facing or simply spark an idea for your current or future data visualization development tasks, we hope you’ll find valuable insights. Each entry will include code snippets and JS chart examples to illustrate the solutions. If you get additional questions or need more details, simply comment below or contact our Support Team directly. We’re here to help enhance your JavaScript charting experience!
Without further ado, welcome to the first edition of JS Chart Tips! Today, you’ll learn how to customize the font of the data grid header in a JavaScript Gantt chart.
- Categories: AnyChart Charting Component, AnyGantt, Business Intelligence, Gantt Chart, HTML5, JavaScript, JS Chart Tips, Tips and Tricks
- No Comments »
Let’s Connect at Qlik Connect 2024: AnyChart Booth #807
May 13th, 2024 by AnyChart Team Qlik Connect 2024 is on the horizon, and we’re pleased to announce that AnyChart will be participating as an Emerald sponsor and exhibitor. Join us from June 3–5 at Rosen Shingle Creek in Orlando, Booth #807!
Read more at qlik.anychart.com »
- Categories: AnyChart Charting Component, Business Intelligence, Dashboards, Gantt Chart, News, Qlik
- No Comments »
How to Create Resource Chart with JavaScript
October 16th, 2023 by Awan Shrestha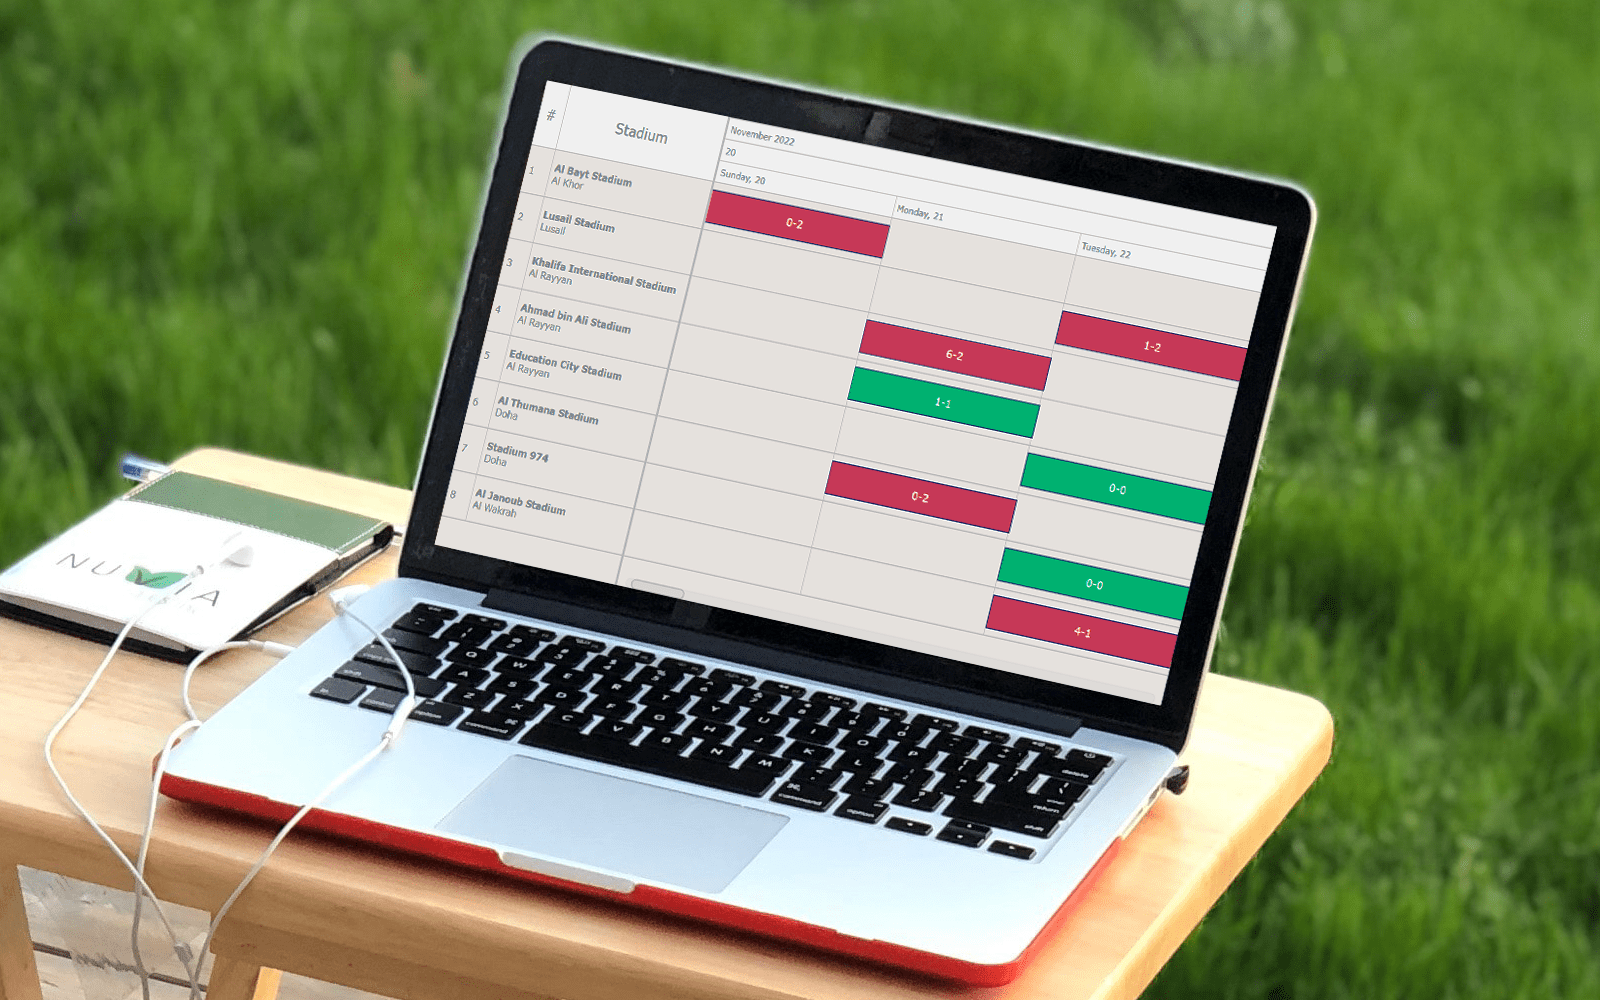 In today’s data-driven world, data visualization simplifies complex information and empowers individuals to make informed decisions. One particularly valuable chart type is the Resource Chart, which facilitates efficient resource allocation. This tutorial will be your essential guide to creating dynamic resource charts using JavaScript.
A resource chart is a type of Gantt chart that visualizes data about resource utilization, such as equipment, employees, and so on. It provides a comprehensive overview, making it easier to make informed decisions promptly. As an illustrative example, in this tutorial, I will represent the FIFA World Cup 2022 Qatar schedule by stadium, enabling you to track when and where each game took place.
Get your coding boots ready, and by the end of this guide, you’ll be well-equipped to create your own JS-based resource chart and have a valuable tool at your disposal for tracking your next favorite tournament, or servers status, or employee project assignments, or anything else of that kind.
Read the JS charting tutorial »
- Categories: AnyChart Charting Component, AnyGantt, Business Intelligence, Gantt Chart, HTML5, JavaScript, JavaScript Chart Tutorials, Tips and Tricks
- No Comments »
Join AnyChart at QlikWorld Tour 2023
August 10th, 2023 by AnyChart Team Get ready to dive into an exceptional data experience at QlikWorld Tour 2023! We at AnyChart are super stoked to be part of this epic roadshow as proud sponsors and warmly invite you to join us in one of the participating U.S. cities:
- Dallas (The Star in Frisco) — August 10
- San Francisco (Oracle Park) — August 24
- New York (Pier60 at Chelsea Pier) — September 18
- Atlanta (College Football Hall of Fame) — September 20
Spoiler alert: The star of the show will be our first-ever presentation of YODA — Your Own Documents Assistant, the newest, groundbreaking, AI-driven extension for Qlik Sense. Be among the first to witness its power!
Read more at qlik.anychart.com »
- Categories: AnyChart Charting Component, AnyGantt, Big Data, Business Intelligence, Dashboards, Gantt Chart, News, Qlik
- No Comments »
Viva Qlik with AnyChart — Thank You QlikWorld!
May 24th, 2023 by AnyChart Team Hey, we’d like to share with you the amazing experience QlikWorld provided to its Customers and Partners alike. It was fantastic, and we’re still buzzing with excitement about all that happened in and around Mandalay Bay Las Vegas on April 17–20!
First and foremost, our Decomposition Tree extension for Qlik Sense stole the show…
Read more at qlik.anychart.com »
- Categories: AnyChart Charting Component, AnyGantt, Big Data, Business Intelligence, Gantt Chart, Qlik
- No Comments »
New Progress Tracking Features for Gantt Charts in Qlik Sense
January 24th, 2023 by AnyChart Team![]() Tracking project progress using Gantt charts in Qlik Sense has become even easier with the latest update of our dedicated extension! Learn about the just-released features and improvements. Then update to the newest version of AnyGantt for Qlik and check them out in action!
Tracking project progress using Gantt charts in Qlik Sense has become even easier with the latest update of our dedicated extension! Learn about the just-released features and improvements. Then update to the newest version of AnyGantt for Qlik and check them out in action!
Read more at qlik.anychart.com »
- Categories: AnyChart Charting Component, AnyGantt, Big Data, Business Intelligence, Dashboards, Gantt Chart, News, Qlik
- No Comments »
AnyChart JS Charts 8.11.0 Released with Awesome New Data Visualization Features
December 7th, 2021 by AnyChart Team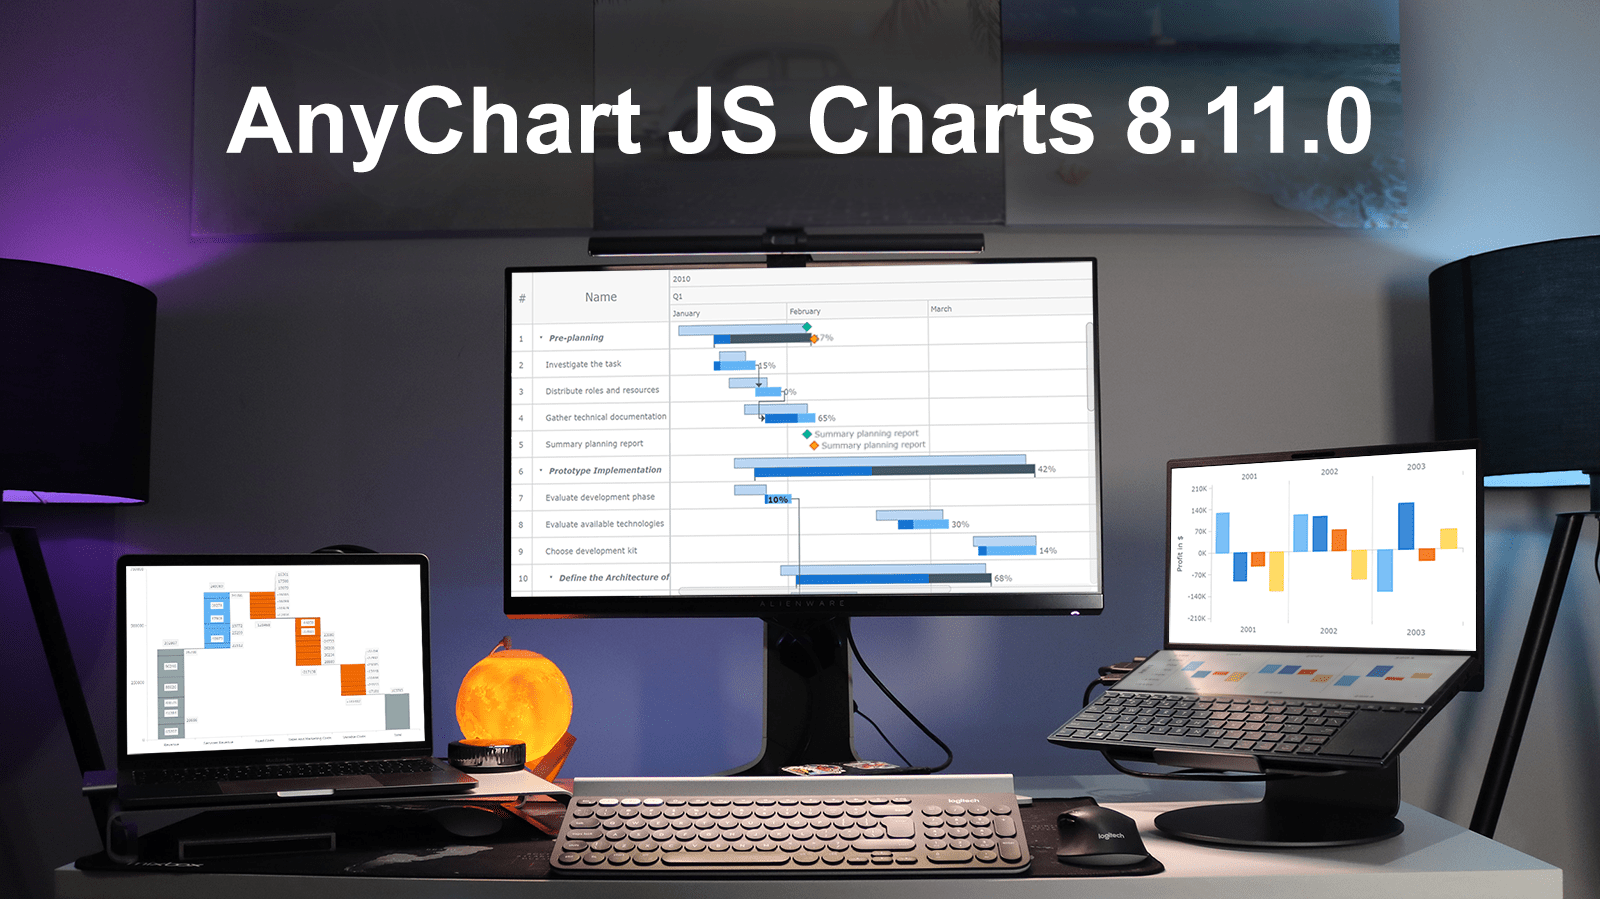 Excited to tell you we’ve just pushed a major update to our JavaScript charting library! The newly arrived features and improvements make our core solution even more flexible, adding awesome fresh capabilities designed to further help you on your data visualization development journey. Intrigued? Let us show what’s new in AnyChart JS Charts 8.11.0 right away!
»»» See What’s New in AnyChart 8.11.0! «««
- Categories: AnyChart Charting Component, AnyGantt, Gantt Chart, HTML5, JavaScript, News
- 3 Comments »
Building JS Resource Gantt Chart to Visualize Tokyo 2020 Paralympic Schedule
August 17th, 2021 by Shachee Swadia Smart resource allocation is a must to achieve a high level of operational efficiency. Aiming to ensure it, project management professionals commonly rely on a special form of data visualization called a Resource Gantt chart. Creating graphics like this may seem daunting at first sight. But I am here to show you an easy way to build Resource Gantt charts with JS using a compelling, topical example.
Resource Gantt charts, also known as simply Resource charts, consist of bars oriented along the horizontal axis. Each bar visualizes a resource used by an activity, with the length representing the duration while that resource is occupied by that activity. The left and right edges of the bars display the start and end times. The resources, or event labels, are listed on the left. The dates and times are shown in the header.
Tokyo 2020 Paralympic Games are just around the corner. So, I decided to visualize their sports program by venue. Follow along with this stepwise tutorial and you will learn how to create a cool JavaScript Resource Gantt chart visualizing the Tokyo 2020 Paralympic schedule!
Read the JS charting tutorial »
- Categories: AnyChart Charting Component, AnyGantt, Big Data, Business Intelligence, Gantt Chart, HTML5, JavaScript, JavaScript Chart Tutorials, Tips and Tricks
- No Comments »