AnyChart Triumphs Again: Awarded Best in Data Analytics and Visualization in 2024
February 19th, 2024 by AnyChart Team We are delighted to announce that AnyChart has won the prestigious 2024 DEVIES Awards in the Data Analytics & Visualization category, marking our victory for the second consecutive year!
The award celebrates our JavaScript charting library, continuously acknowledged as the world’s leading data visualization solution for developers. As AnyChart JS forms the cornerstone of our broader product line, this recognition once again highlights the technological excellence and innovation inherent in our entire suite of offerings, including the extensions for Qlik Sense.
- Categories: AnyChart Charting Component, AnyGantt, AnyMap, AnyStock, Big Data, Blogroll, Business Intelligence, Dashboards, Financial Charts, Gantt Chart, HTML5, JavaScript, News, Oracle Apex, Qlik, Stock Charts, Success Stories
- No Comments »
MARVI Project Uses AnyChart Android Charts to Visualize Groundwater Data in MyWell App
May 25th, 2023 by AnyChart Team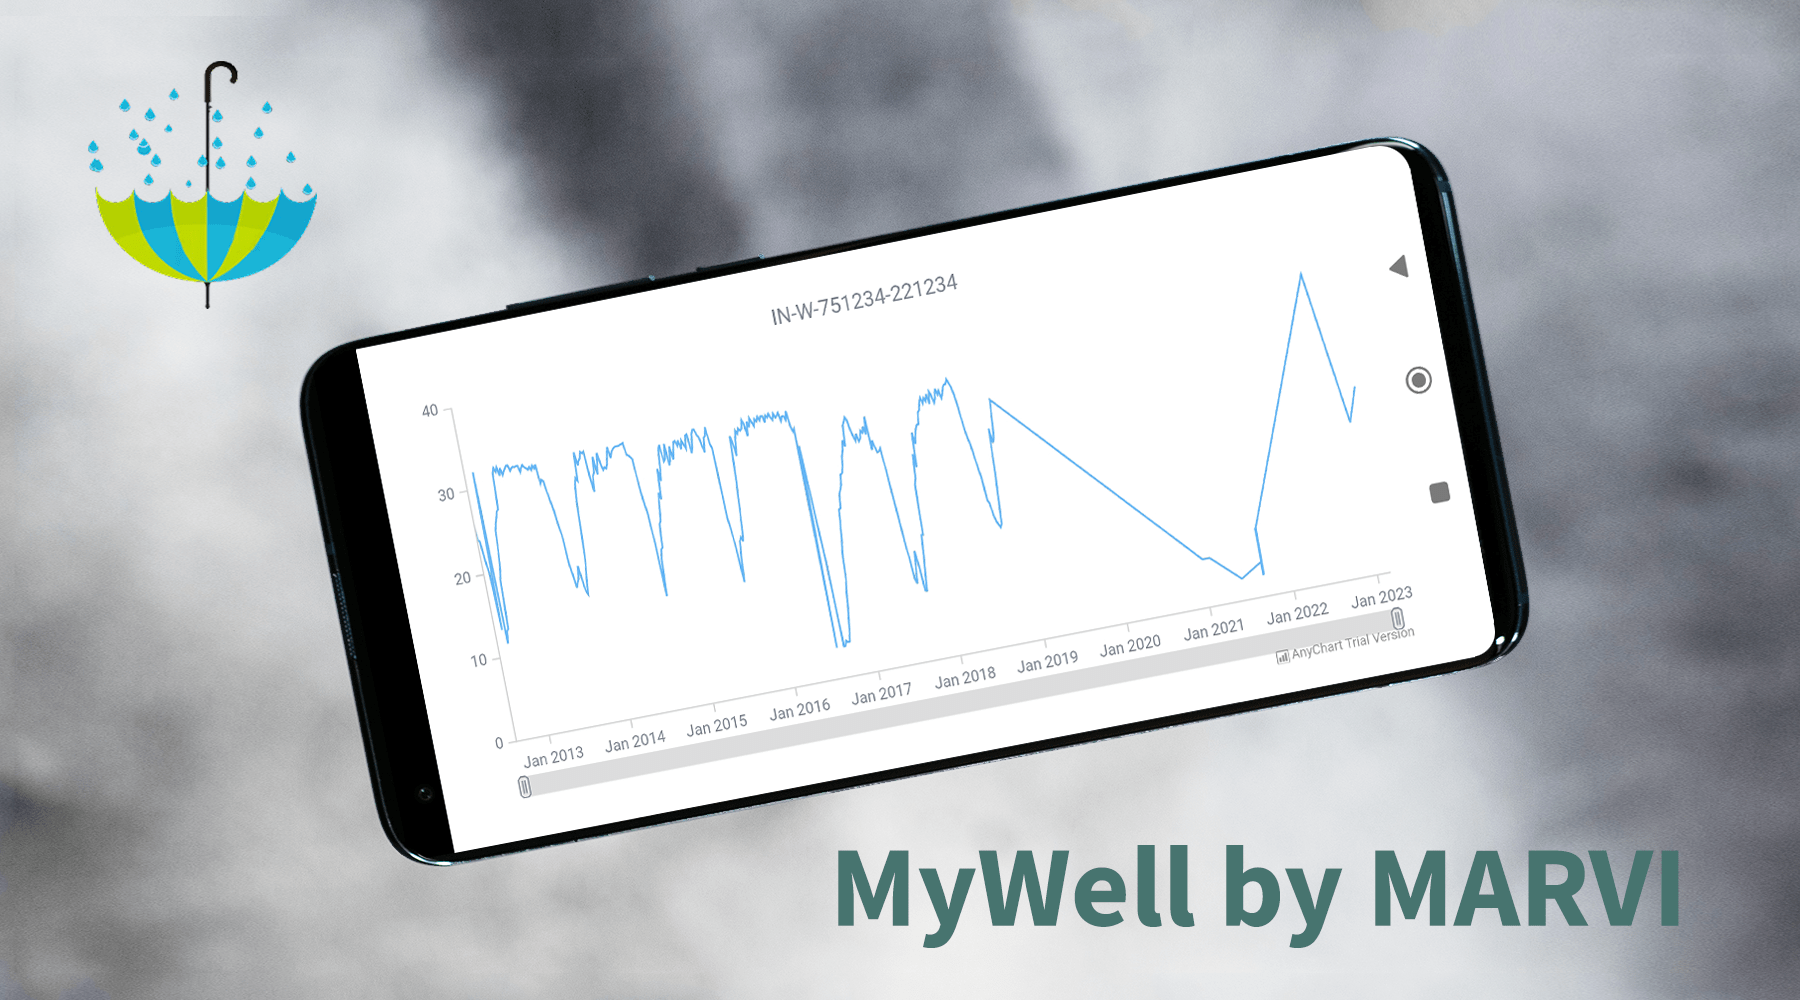
At AnyChart, we take great pride in our position as leaders in the global data visualization industry. Our JavaScript Charting Library is renowned for its excellence for developers, while our Qlik Sense Extensions continue to push the boundaries with innovative solutions for analysts. But we don’t stop at being awesome! We also bring the ultimate data visualization magic to Android app developers with AnyChart Android Charts! You’ve probably come across these charting wonders in some of your favorite mobile apps. Today, we’re putting the spotlight on one specific use case that caught our attention.
We recently had a blast speaking with Professor Basant Maheshwari, the lead scientist at the MARVI project. Their mission? To revolutionize groundwater management through community empowerment. They are achieving that with the help of MyWell, a mobile app that streamlines crowdsourced data collection to sustain groundwater resources, ensure access to clean drinking water, and boost livelihoods. MyWell harnesses the power of our Android data visualization library. And to fuel MARVI’s noble mission, we provided them with a complimentary license to wield the mighty AnyChart within the app.
Dive into the inspiring world of MARVI and MyWell, and witness firsthand how AnyChart contributes to making a real difference for ordinary people while paving the way for the future of groundwater management.
- Categories: AnyChart Charting Component, AnyStock, Big Data, HTML5, JavaScript, Stock Charts, Success Stories
- No Comments »
Android Charts Made Easy – Meet AnyChart Library for Data Visualization in Android Apps!
November 21st, 2017 by AnyChart Team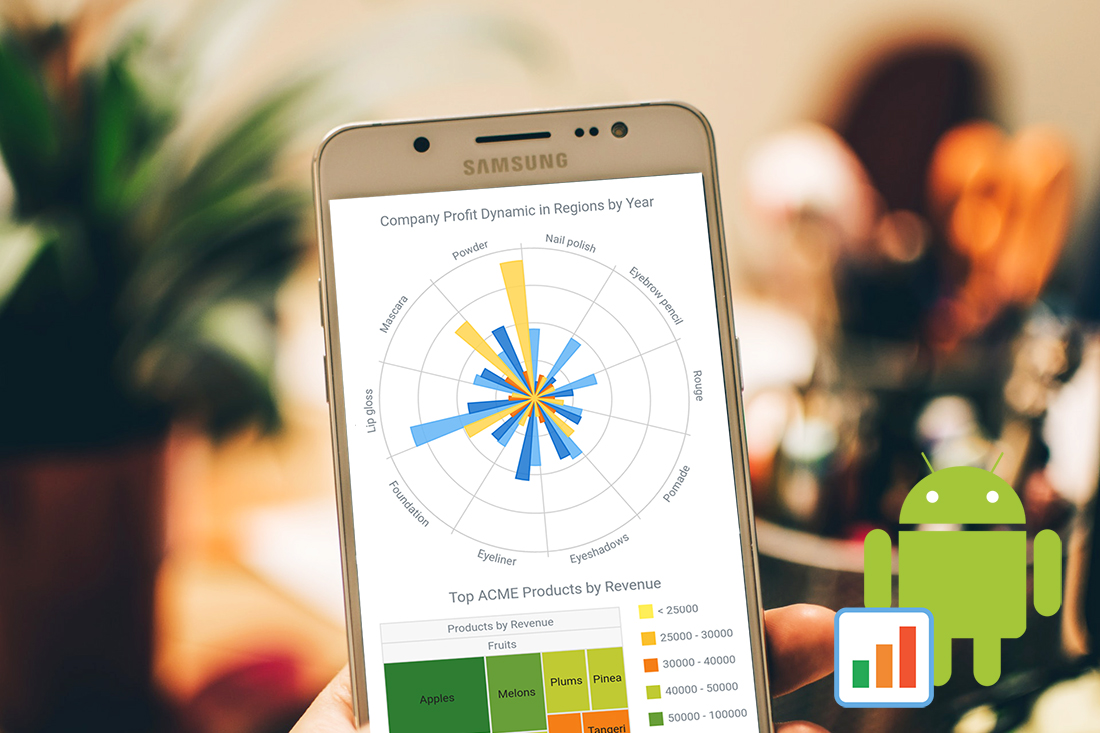 Android app developers can now use AnyChart Java wrapper to run our interactive data visualization solutions in native Android apps! Meet AnyChart Android Charts!
It’s a stunning data visualization library for making interactive HTML5 charts in Android apps, running on API 14+ (Android 4.0). AnyChart supplies dozens of different chart types and seamlessly works with any data from any database.
- Categories: AnyChart Charting Component, HTML5, News, Tips and Tricks
- 12 Comments »