At AnyChart, we take great pride in our position as leaders in the global data visualization industry. Our JavaScript Charting Library is renowned for its excellence for developers, while our Qlik Sense Extensions continue to push the boundaries with innovative solutions for analysts. But we don’t stop at being awesome! We also bring the ultimate data visualization magic to Android app developers with AnyChart Android Charts! You’ve probably come across these charting wonders in some of your favorite mobile apps. Today, we’re putting the spotlight on one specific use case that caught our attention.
We recently had a blast speaking with Professor Basant Maheshwari, the lead scientist at the MARVI project. Their mission? To revolutionize groundwater management through community empowerment. They are achieving that with the help of MyWell, a mobile app that streamlines crowdsourced data collection to sustain groundwater resources, ensure access to clean drinking water, and boost livelihoods. MyWell harnesses the power of our Android data visualization library. And to fuel MARVI’s noble mission, we provided them with a complimentary license to wield the mighty AnyChart within the app.
Dive into the inspiring world of MARVI and MyWell, and witness firsthand how AnyChart contributes to making a real difference for ordinary people while paving the way for the future of groundwater management.
AnyChart: To start with, could you please introduce yourself to our community?
Basant Maheshwari: Hello, I am Basant Maheshwari, and my position is Distinguished Professor in Water, Environment and Sustainability at Western Sydney University in Australia.
I have been working on a project called MARVI — Managing Aquifer Recharge and Sustaining Groundwater Use through Village-level Intervention. The project has been running in Rajasthan and Gujarat states in India for the last 11 years, and it aims to improve the management of groundwater resources in India and beyond.
A: How significant is this issue you are solving at MARVI?
BM: Groundwater is very important in many parts of the world. In India, groundwater is the main source of drinking water in rural areas (>80%). About 60% of the water for irrigated agriculture is sourced from groundwater. The depth of groundwater used to be 5-15 m about 50 years ago and now it is more than 40 m and in some places it has gone more than 300 m.
The scarcity of groundwater affects food production and safe and clean drinking water supplies. It also affects the livelihood of people. And the education of girls, as they have to fetch water from a longer distance when groundwater is not locally available; as the groundwater goes deeper, the attendance of female students drops as they have to help their families fetch water.
A: And how does MARVI contribute to addressing it?
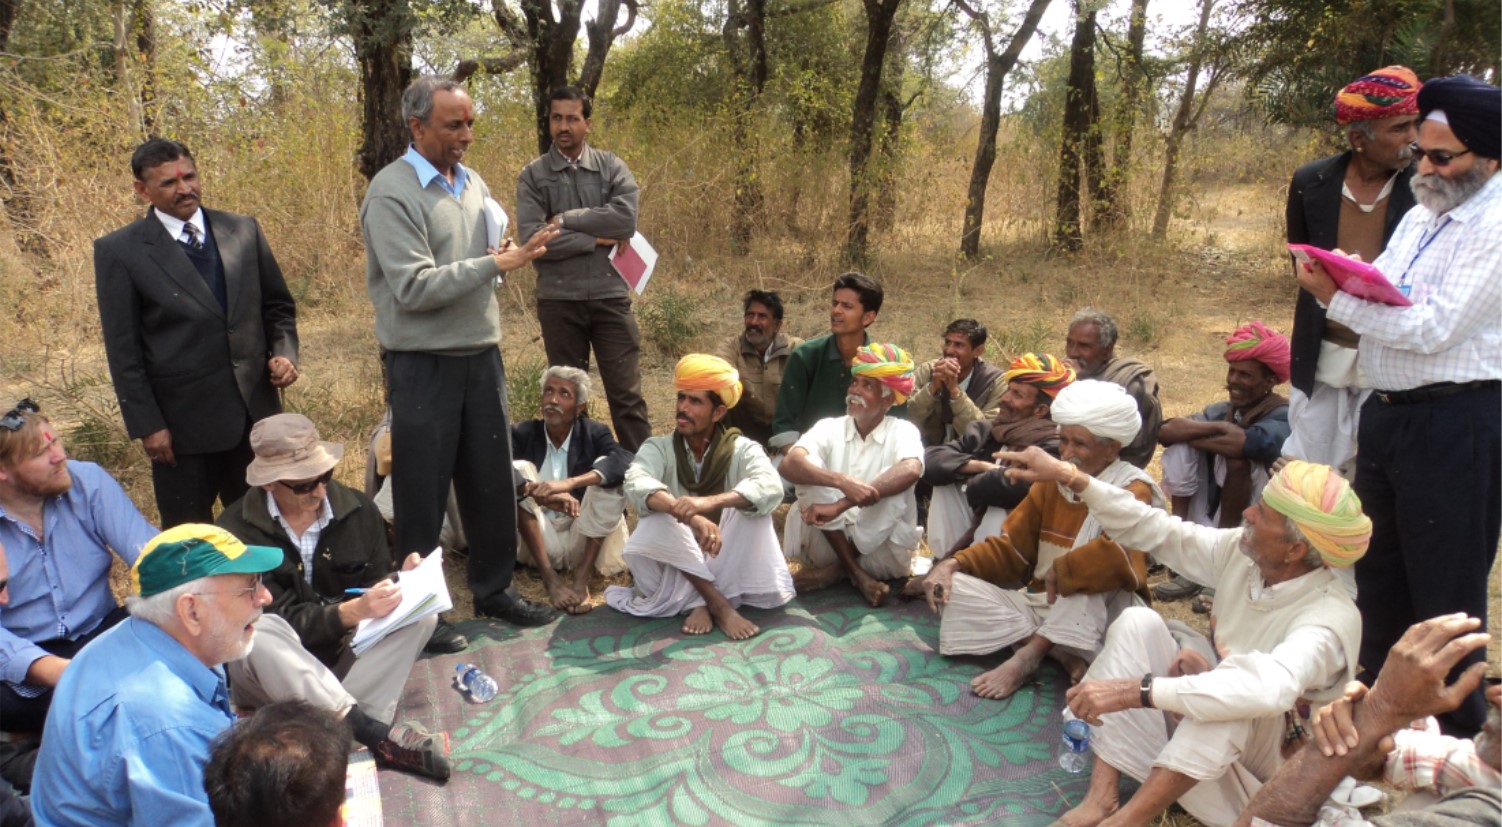
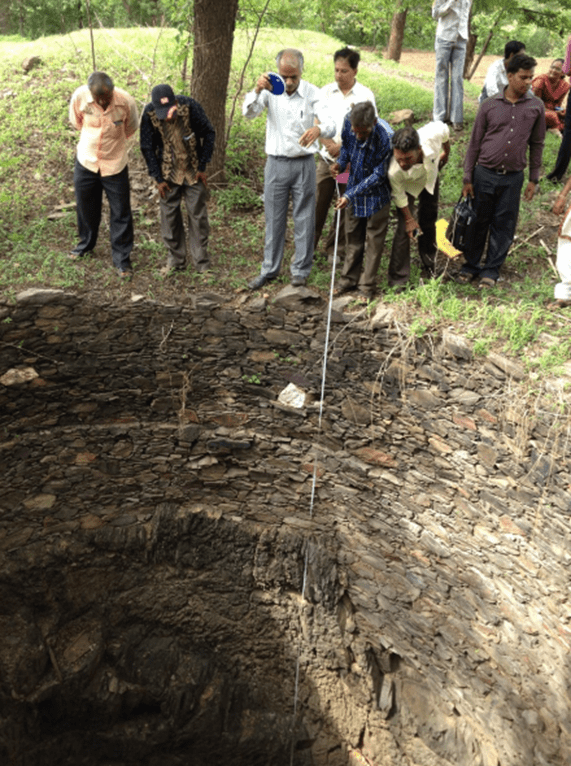
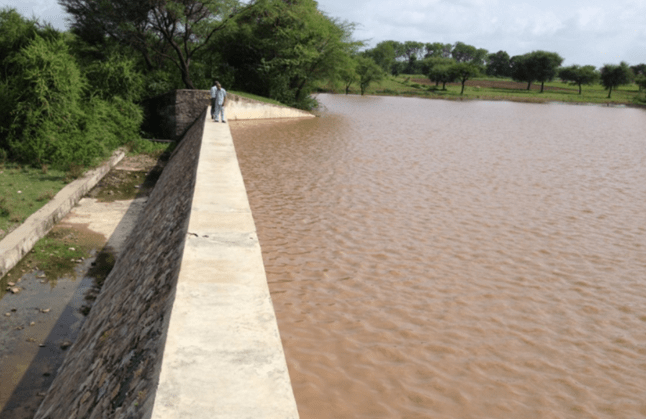
BM: The MARVI project is focused on participatory groundwater monitoring and management. This means that local farmers and others in the community are involved in monitoring groundwater depth, rainfall, water quality, and check dam water levels. They act as citizen scientists. The monitoring of local water data helps farmers and others understand their groundwater situation, plan actions, and cooperatively work to share and sustain groundwater resources.
The MARVI project has been successful in improving the management of groundwater resources in India. It has helped to reduce groundwater depletion, improve water quality, and increase agricultural productivity. MARVI is an example of how participatory groundwater management can be used to improve the sustainability of groundwater resources. The project has demonstrated that local communities can be effective partners in managing groundwater resources.
 |
 |
 |
A: How do you handle data?
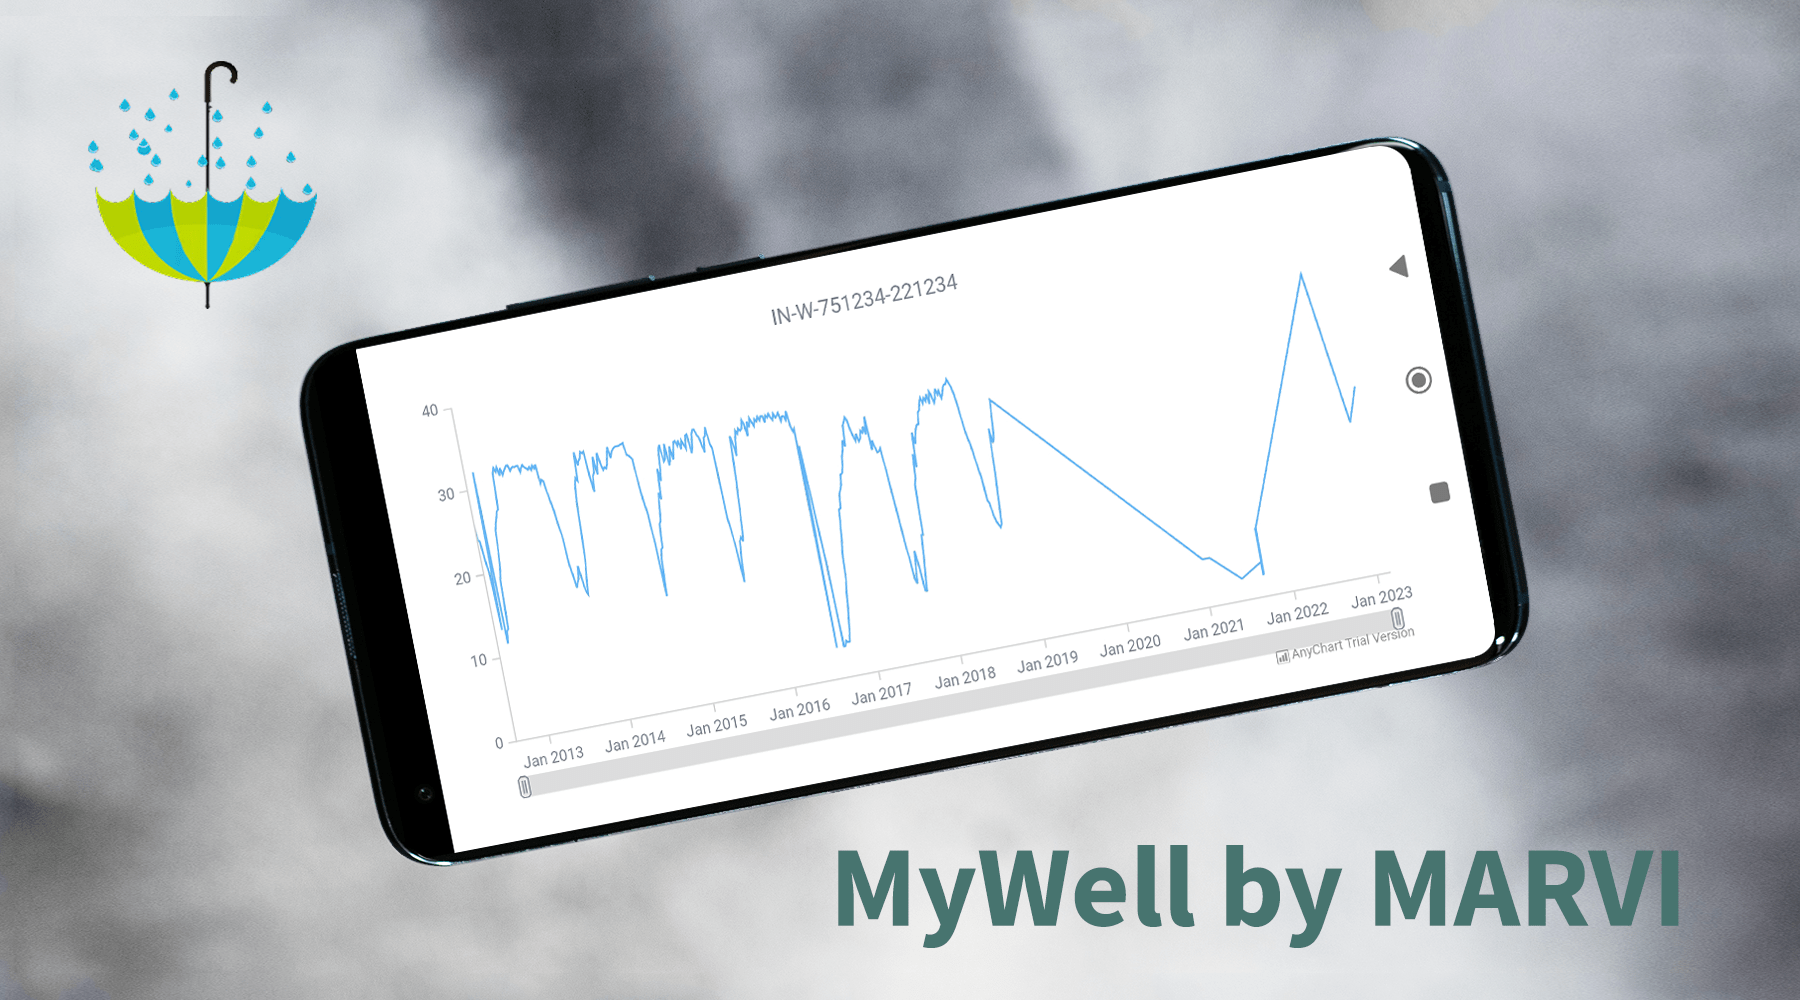
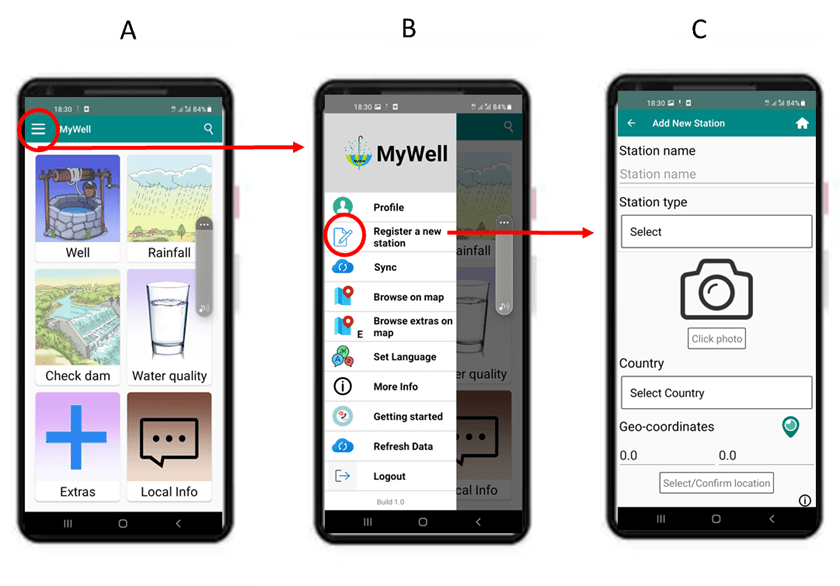
BM: The data collection by citizens led to the development of an Android app called MyWell. It helps to report data and make it available to anyone and anywhere.
The app was formally launched by the Ministry of Water Resources of India for use by farmers, volunteers, and non-governmental organizations (NGOs) across India. Now MyWell is also being used by farmers and other community members in Sri Lanka, Uganda, Botswana, Ethiopia, Laos, Thailand, and many other parts of the world.
The data needs to be visualized, and that is where the role of AnyChart became important.
A: Why do you need data visualization, and how does AnyChart help?
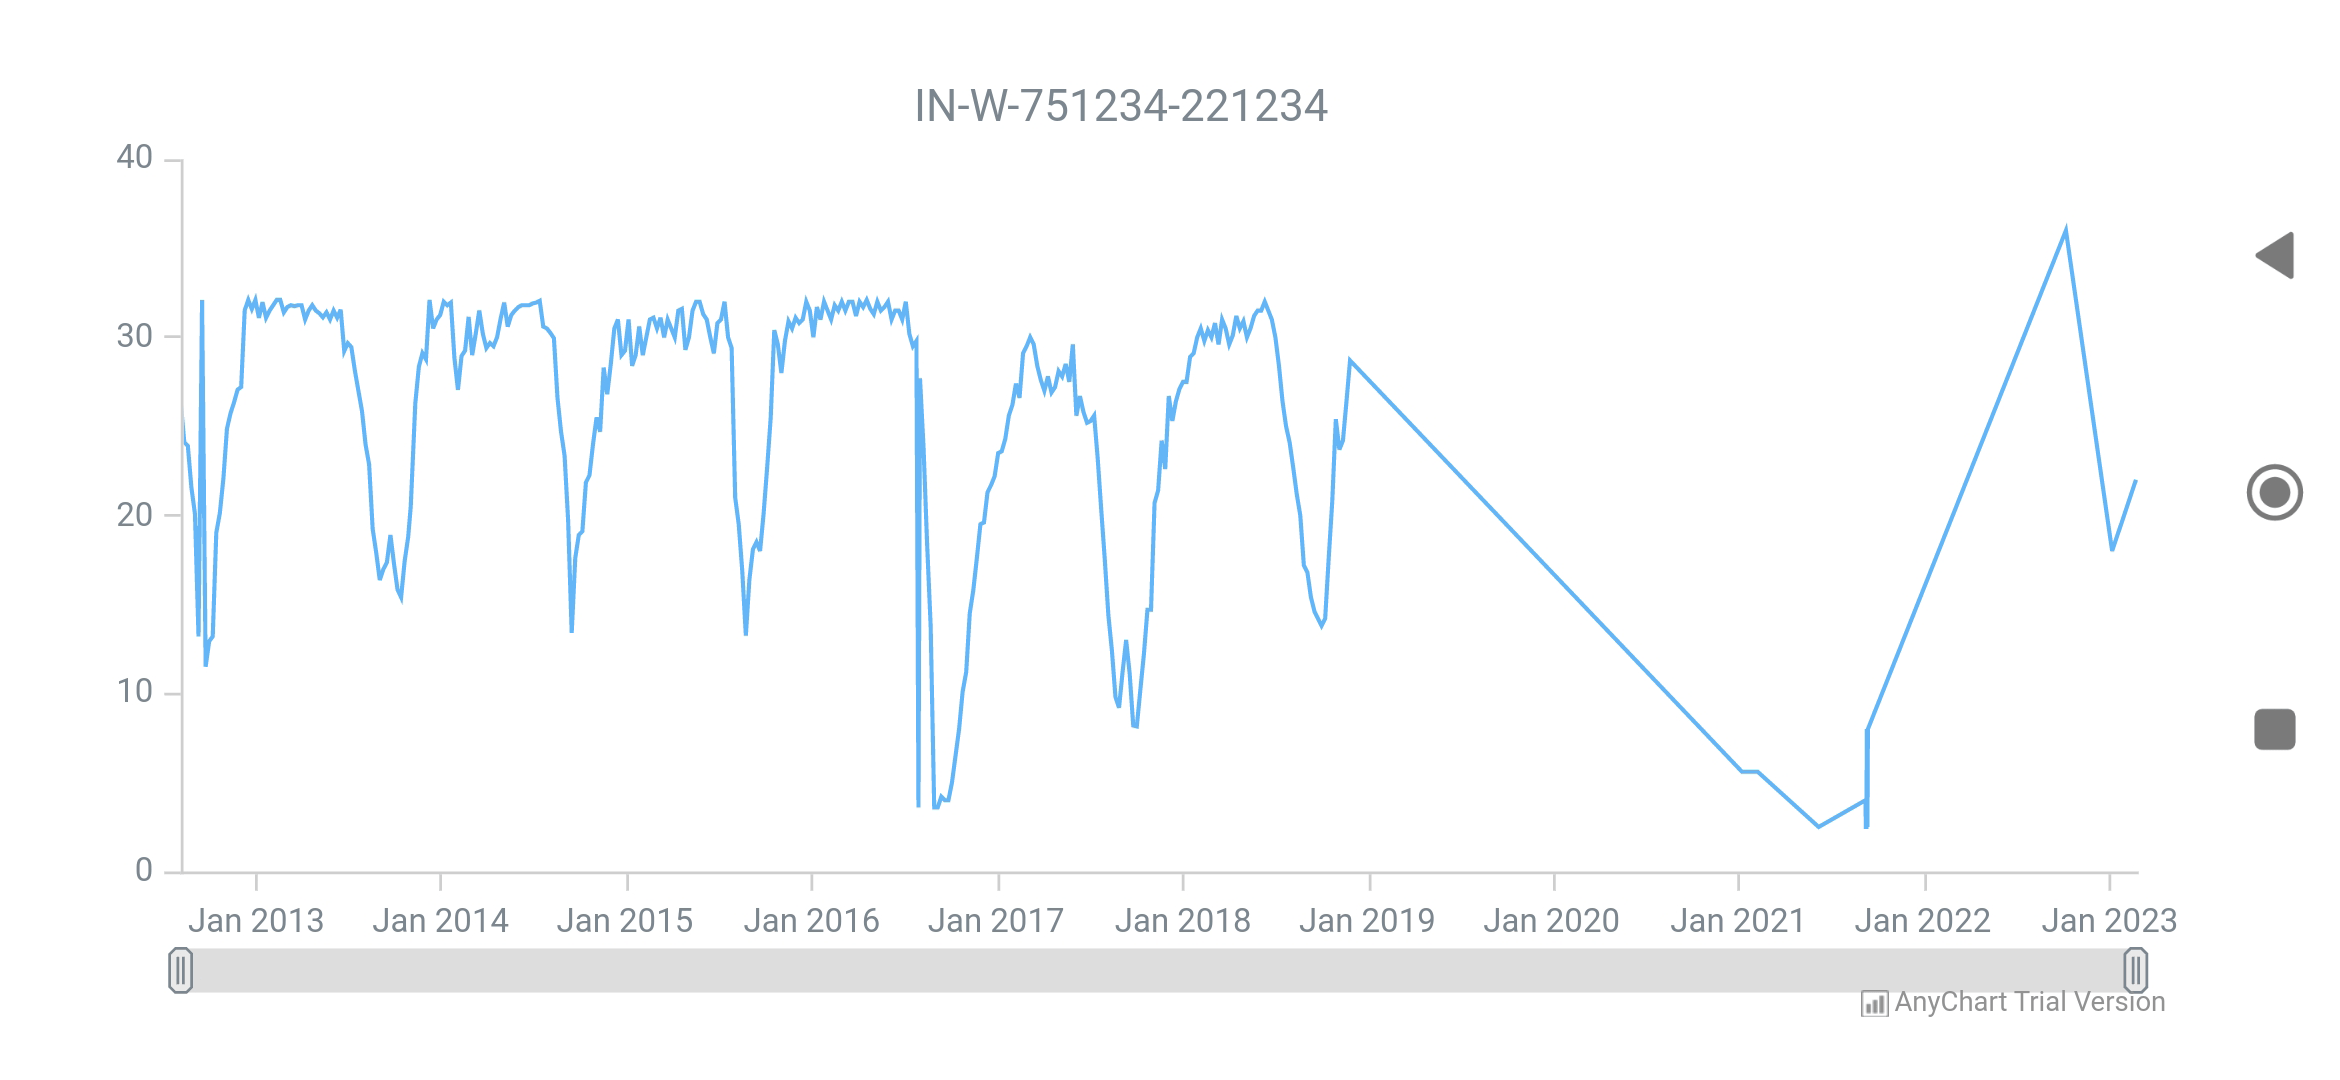
BM: Groundwater is underground, so it is an ‘invisible’ resource. Charts let us make it visible, so people can see how their groundwater levels are fluctuating. Data visualization helps to get the meaning of the data more clearly. This enables farmers to have a more objective discussion at the village level on what to do to make groundwater more sustainable and work together to plan some actions.
Your Android charting library has helped us visualize data over time in line charts so that farmers and other people can see at a glance how their groundwater levels, rainfall amounts, etc. are varying from one week to the next, one month to the next month, and one year to the next year.
A: Can you provide some insights into the technology stack that you rely on?
BM: I am not a programmer, but we recruited one, Mr. Deepak Patidar from Excel Geomatics. I have closely worked with him and the team from Western Sydney University, Mr. David Wichert and Mr. Michael Macken, to develop and implement the MyWell app. So, for the Android app development, we are using Android Studio and the Java programming language. We are also using Visual Studio and the C# programming language for the web app. For databases, our choice is SQL Server. We also used .NET for developing the API.
A: Did you encounter any challenges while integrating AnyChart Android Charts into your stack?
BM: In the beginning, we faced some difficulties. Partly due to our programmer also learning to build the app. But with the help of your Support Team, we were able to make it work the way we wanted.
A: What is it about AnyChart that you find most appealing and enjoyable?
BM: Once set to work, your Android library plots the graphs without a problem. It has many chart options and features, making it quite versatile. And we are very grateful to your company for providing a free license. AnyChart is now an integral part of the MyWell app.
A: How can we improve AnyChart? Any suggestions or areas you feel we might be missing?
BM: Some guidance on how to use AnyChart and examples are already available online. However, it would be very helpful to have a more detailed step-by-step guide and more ready-made templates for common applications.
A: If a friend asked you which charting library to use for data visualization in Android apps, how would you recommend AnyChart?
BM: If you’re seeking to visualize data in an Android application meaningfully and with a wide range of options, AnyChart is the one to turn to.
A: Thanks for answering our questions! We’re glad to hear that our solution has been helpful. Best wishes to you and your colleagues!
If you’d like to share your AnyChart story, please let us know.
See more customer stories on our blog.
- Categories: AnyChart Charting Component, AnyStock, Big Data, HTML5, JavaScript, Stock Charts, Success Stories
- No Comments »