January 22nd, 2013 by Timothy Loginov
A new version of AnyChart Stock and Financial Charts is available – AnyStock 1.8.0. In this version you will find a number of great new features and improvements. Now you can easily show positive and negative Infinity on your chart, enjoy full support for the scientific number format in CSV, and use some other new options. For more detailed information, please see links to our documentation and Knowledge Database.
New features
Improvements
- Full support for the scientific number format in CSV.
- Single point data sets display is improved.
Bugfixes
- NaN labels no longer show up when extra axes with no series bound are used.
- Preset buttons are now updated properly when the StockMain.selectRange() method is used.
- Minor calculation issues with Y-Axis scale are fixed.
- Point order on multiple append is now treated correctly.
Note: if you are using the applySettingsChanges() method along with drawing annotations, you may encounter errors on update if any of the charts doesn’t have an id, so please always assign an id to the chart in such cases.
Here you can see AnyStock version history: http://6.anychart.com/products/anystock7/history/
The new version is available for trial download: https://www.anychart.com/download/
December 25th, 2012 by Margaret Skomorokh
Merry Christmas and a wonderful New Year to all our customers and friends around the world and thank you for your support.
AnyChart keeps moving forward – this year we have significantly improved our HTML5/JavaScript engine, making it almost as functional as the Flash version, introduced seven releases, implemented a number new features, and successfully survived the end of the world. The circle of our customers has widened: here is only a small part of them – those who agreed to make success stories with us.
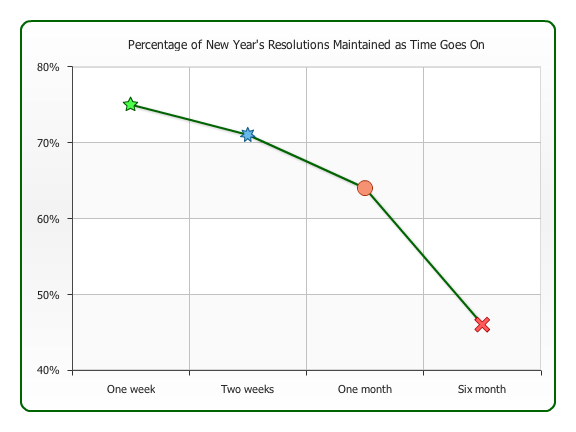
According to statistics, 75% of resolutions made by Americans are maintained during the first week of the new year, past two weeks – 71%, after one month – 64%, and after 6 months – only 46%:
AnyChart’s resolution is to continuously refine our products and provide the best support. We are sure to hold out the whole year 🙂
November 30th, 2012 by Margaret Skomorokh
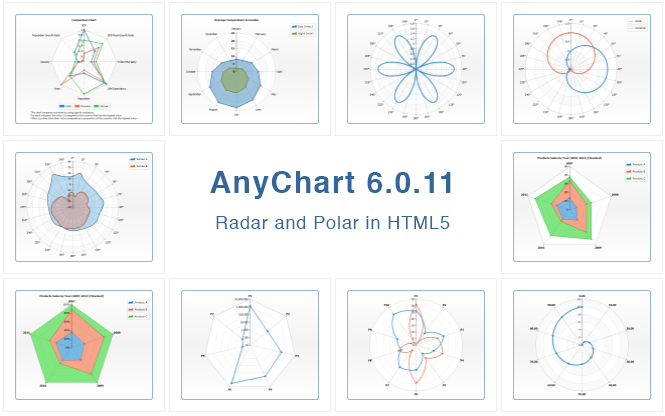
We are glad to announce that AnyChart 6.0.11 is now available for download. Our team keeps improving the HTML5 engine and broadening the range of features supported by it. We have also made a number of important bug fixes both for the HTML5 and Flash engine.
New HTML5 features:
- Radar plots
A radar plot is a graphical method of displaying multivariate data. Variables are represented on axes starting from the same point, where the relative position and angle of the axes is uninformative. It is also known as spider chart, star chart, kiviat diagram, etc. AnyChart allows displaying three types of series on radar charts: Line, Area and Marker.
- Polar plots
A polar plot is a plot drawn on a circular grid, showing trends in values on the basis of angles: each point on a plane is determined by a distance from a fixed point and an angle from a fixed direction. AnyChart allows drawing Line, Area and Marker series on polar plots.
- Indicator and Bulb gauges
- Label gauges
- Circular gauges (now fully supported)
HTML5 bug fixes:
- The getInformation() method obfuscation problem with Gauge charts is fixed.
- Axis Crossing attribute problems are fixed.
- Bar/Line overlay problems are fixed.
Flash bug fixes:
- Flex component no longer throws an error when the legend is enabled in charts.
- Marker series are now properly animated.
And the last, but not the least: we have solved the problem with maps in Chrome. Pepper Flash Chrome plugin peculiarities make it impossible for AnyMap of earlier versions to work properly, and there is only way to avoid this for sure: upgrade to AnyChart 6.0.11.
The full list of improvements: http://6.anychart.com/products/anychart7/history/
Trial download: https://www.anychart.com/download/
November 13th, 2012 by Margaret Skomorokh
AnyChart Stock and Financial Charts, our tool for visualizing time-based data, is sophisticated and fast at the same time – but with some simple tricks, you can improve its performance even more. Here are nine tips for AnyStock best peformance with the links to detailed instructions and samples in our documentation:
1. When you have thousands of points on the chart, it is a good idea to use data grouping. Ungrouped data always slows the chart due to the fact that you actually have thousands of objects added to the plot. Grouping limits the number of objects displayed and keeps the ability to zoom in and see actual data.
2. Ungrouped data is particularly slow when you have a lot of peaks (i.e. sets like (1,-1,1,-1,1,1…) with more than a thousand of points). The reason is Flash poor performance with drawing vertical lines. This problem can be solved by turning on grouping, but please do not forget that the scroller thumbnail series always shows ungrouped data, so it is better to turn it off. To learn how to do it, please see: Scroller without Data Provider.
If you operate “peaky” data sets, by the same reason a Stick series performs better than a Bar series, Line — even better than Stick, and the utmost performance can be reached with a Marker series.
3. Using live update options, you should be careful with the number of technical indicators – due to their nature they are recalculated when new data arrives and sometimes may slow things down. However, calculation takes only 10% of time, and 90% is consumed by redrawing, so you should note this only when data set has more than 10.000 points and you are using more than 10 indicators.
4. The best timestamp format is %T since it is not converted on a data set parsing stage and is used as is. The %u timestamp format is good too. All “normal” date/time formats slow the performance down because they need to be converted into %T before being used by the internal data storage. See more: Timestamps in Milliseconds.
5. If you are using live update with the appendData() method, it is better to do, for example, one update with 5 rows each 10 seconds, rather than five updates with 1 point each 2 seconds.
6. Annotations slow the rendering down when you have more than a hundred of them on a chart (this will be improved in the future versions).
7. In case of a bad mouse-over experience, you may consider dropping the use of the {%SeriesIcon} token in the legend and use either text coloring or a UTF full block (U+2588) symbol.
8. If the Scroller responsiveness is poor, try to use the former without a data provider. To learn how, see the sample XML: Scroller without Data Provider.
9. If you are using ungrouped data, and the mouse-over performance is poor, please check if markers are enabled and consider disabling them.
September 26th, 2012 by Margaret Skomorokh
Today we are glad to publish a new customer success story – about AnyStock and Spread Co.
 Spread Co, founded in 2006, is one of the leading providers of Contracts for Difference and Spread Trading in the UK, with partnerships in a number of locations worldwide, including Central and Eastern Europe, Scandinavia, the UAE and South America. The company offers three trading platforms: a downloadable desktop platform Saturn Trader, Saturn Mobile for iPhone, and Saturn Web for online trading.
The challenge was:
- To find a reliable and fast Flash-based charting solution that could be controlled from a JavaScript API in order to implement a visualization for Saturn Web – an online multi-asset trading platform supporting Foreign Exchange, CFD Trading and Spread Betting.
- To provide tools for technical analysis, the ability to add annotations and draw on charts.
Solution:
- The AnyChart Stock component was chosen as a solution, having an extensive JavaScript API and great opportunities for customization. The component comes with a special JavaScript library that controls all the aspects of the interaction between the chart, the HTML page, and the server.
- AnyStock supports annotations, a complete list of drawing tools, and 30 automatically calculated technical indicators and overlays.
You can enjoy the full success story here:
Or see other AnyChart Customers Success Stories.
July 11th, 2012 by Margaret Skomorokh
We are proud to announce the release of AnyChart Stock and Financial Charts 1.7.0. We have made some significant changes and added a number of new features. Some of the improvements impact the default settings. Please take a moment to familiarize yourself with these changes prior to deploying.
The most important changes are in Fibonacci annotations settings and defaults: they have new defaults and are displayed in a new, different, and better way. Level labeling has been added and enabled by default. Fibonacci Fan now shows not only price levels but also time levels and a grid. If you upgrade to 1.7.0 and use Fibonacci annotations, you will see changes in your charts. However, you can revert to the old view by specifying additional settings in your configuration files.
Additionally, the <export> node is deprecated and replaced by the <export_settings> node, so it is strongly recommended to review your configuration files and make the necessary changes. In JSON configuration this replacement means: export turns into exportSettings. These changes are made to avoid problems with the objectModel chart property in Internet Explorer.
New features
- Fibonacci drawing tools have been significantly improved: you can tune the number and ratios of levels, add level labels, and so on. See:
- New positioning features for Event Markers: now you can place them below series and take into account series values. See Event Markers: Positioning for more.
- New Y Axes scale attributes: scale_start_ratio and scale_end_ratio. They provide a way to overlay charts in a nice way, and are particularly useful when one wants to display a Volume chart on the same plot with a Price chart. See Y Axes Settings: Limiting Scale Draw Region for more.
- New Y Axes scale attrbutes: soft_minimum and soft_maximum. They provide additional tuning options for scale auto calculation modes. See Y Axes Settings: Soft Minimum and Soft Maximum: Tuning Auto Calculation.
Improvements
- The <export> node is deprecated due to the problems it gave when trying to obtain the objectModel property in Internet Explorer. Please use the <export_settings> node instead.
- The logarithmic axis minimum auto calculation is improved.
Bug fixes
- The Scroller thumbnail series no longer displays missing values at the end of a data set as zeros.
- A separated tooltip pin no longer breaks when a zero length range is selected.
- Event markers are properly bound to series fields.
- Flex version no longer throws the errors which occasionally presented themselves while working with the component.
- Fibonacci Arcs geometry issues are fixed.
- Flex iOs mouse over problems are fixed.
- The enabled attribute of the <line> subnode of major and minor grids in axes now works properly.
Here you can see AnyStock version history: http://6.anychart.com/products/anystock7/history/
The new version is available for trial download: https://www.anychart.com/download/
July 11th, 2012 by Margaret Skomorokh
A new version of our charting component is available – AnyChart 6.0.10. The improvements include:
New features
- Circular Gauges Beta have been added to the HTML5 engine.
- The Flex component now provides the getBase64PNG() and getBase64PDF() methods with optional width and height parameters.
Bug fixes for the HTML5 engine
- Custom attributes are now correctly set via JSON.
- Custom attributes are now correctly retrieved in point events.
- Action arguments are now correctly passed in JSON.
- The maxChar and maxCharFinalChars formatting options are now supported.
- The autocalculated datetime scale crash is fixed.
- The heatmap lower case row/column names problem is fixed.
- The first stack elements are no longer hidden when the Logarithmic scale is used with the Stacked mode.
Bug fixes for the Flash engine
- “On resize” crash in Flex applications is fixed.
- The getPNG(), getPDF(), saveAsImage(), and saveAsPDF() methods now properly handle optional width and height parameters.
- Marker series is now properly animated.
- Incorrect plot display in 3D mode with scroll enabled is fixed.
- Opacity is now correctly set in 3D “Aqua” pie charts.
- The first stack elements are no longer hidden when the Logarithmic scale is used with the Stacked mode.
- Tooltips are properly positioned in Flex applications with non-absolute layering used.
Here you can see AnyChart version history: http://6.anychart.com/products/anychart7/history/
The new version is available for trial download: https://www.anychart.com/download/
July 2nd, 2012 by Margaret Skomorokh
The numerous industries where AnyChart was applied includes the Email Marketing industry, and today we are publishing a success story about this case.
 Extravision, founded in 2004, is a privately owned UK-based email service provider that offers flexible email marketing solutions to both small and large businesses across all sectors. Its products include Extravision Messenger, which enables users to create and send email marketing campaigns, and Extravision Reports — a tool designed to assess the ROI and effectiveness of email campaigns sent via Extravision Messenger.
The challenge was:
- To enhance the display of the top email reporting statistics within Extravision Reports.
- To create a style that is easy for users to interpret and digest.
- To visualize different types of data: opens, clicks, and unsubscribe percentages as well as some time-based metrics.
Solution:
- AnyChart was chosen to visualize the statistics due to its flexibility and opportunity to create visually appealing and readable charts.
- AnyChart has all the features needed to easily configure charts and customize the style.
- Opens, clicks and unsubscribes were displayed in a pie chart format which allows users to see in an instant the success of their email campaigns. Line charts were used to display time-based data.
You can enjoy the full success story here:
Or see other AnyChart Customers Success Stories.
June 29th, 2012 by Margaret Skomorokh
We are glad to present a new customer success story that demonstrates how AnyChart was used to visualize water quality and weather data.
 The National Estuarine Research Reserve System (NERRS) is a partnership program between the U.S. National Oceanic and Atmospheric Administration and the coastal states, established in 1972. It encompasses a network of 28 areas representing different biogeographic regions of the United States that are protected for research, education, and stewardship. Quantitative measurements within the program concern both short-term variability and long-term changes in the water quality and weather of estuarine ecosystems. The NERRS Centralized Data Management Office is charged with managing and disseminating these data.
The challenge was:
- To provide graphs of near real-time water quality and weather data that is transmitted hourly from National Estuarine Research Reserves across the United States.
- To allow users, which vary from local fishermen to research scientists, a quick and clean way to view data from one or multiple parameters (such as air temperature, wind direction, salinity, etc.) for the past 24 hours.
The solution consisted in the following:
- AnyChart’s charting technology was chosen as a solution. Data from an SQL database is converted to the XML format by ColdFusion and passed to the Flex version of AnyChart component, which is an easy and quick way to update the graphs.
- AnyChart’s ample opportunities for customization were used to create comprehensible and clear interactive visualizations.
This visualization is publicly available through the NERRS Centralized Data Management Office Real Time Data Application
You can enjoy the full success story here:
Or see other AnyChart Customers Success Stories.
June 5th, 2012 by Margaret Skomorokh
We have released AnyChart 6.0.9, and now our HTML5 engine supports the following features:
- blur effect in 3D Pie Charts,
- cone shape in Bar Series,
- dashed lines,
- hatch fill.
We also have fixed a number of bugs, mostly of the HTML5 engine:
- HTML5 engine no longer creates functions and variables in the global document namespace.
- Memory leak problem in TreeMaps and AxisBased charts is solved.
- Multiple axes markers display problems is solved.
- The {%AxisMax} and {%AxisMin} tokens are calculated properly now.
Here you can see AnyChart version history: http://6.anychart.com/products/anychart7/history/
The new version is available for trial download: https://www.anychart.com/download/