AnyChart, AnyMap, and AnyGantt 7.6.0
August 13th, 2015 by Margaret Skomorokh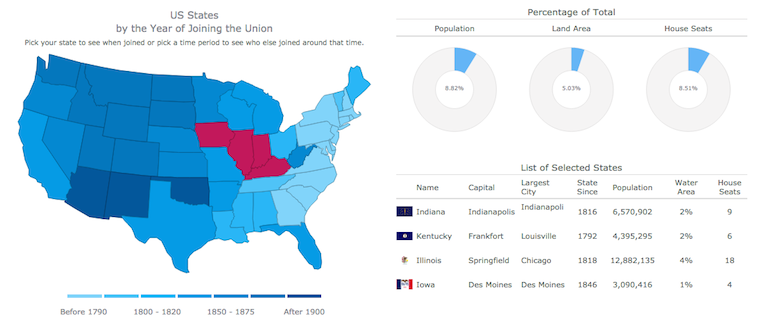
We are proud to announce 3 new releases – AnyChart 7.6.0, AnyMap 7.6.0, AnyGantt 7.6.0. Our team has been working hard to make our products even more aesthetically pleasing, and now all AnyChart charts have a new modern look and design (See the New Look and Theming feature). We have also added a number of other great improvements, and here are the most important of them:
AnyChart 7.6.0 New Features
 |
All AnyChart products now support the Theming feature which makes customizing and integrating charts easier. With Theming, you can set similar visual and functional settings for all charts without duplicating your code. Take a look at Gallery samples >> Learn more about Theming >> |
 |
Crosshairs are thin vertical and horizontal lines centered on a data point, which are useful when you want to locate a point precisely on your chart or to analyse data by comparing different charts. Take a look at a Gallery sample >> Learn more about Crosshair >> |
 |
Pie/Donut Charts are popular, nice-looking, and very easy to understand, and now you can make them even more attractive by adding 3D! Take a look at Gallery samples >> Learn more about 3D Pie Chart >> |
AnyMap 7.6.0 Features
- Choropleth Maps provide an easy way to visualize how a measurement varies across a geographic area.
- Ordinal Color Range looks like several boxes of different colors which depend on the palette chosen according to the type of a map and its data.
- Quantitative Color Range is a bar colored with a gradient, its colors depend on the palette of a map and its data.
- Full Compatibility with other Charts – when you need to show any extra information along with a map – no problem! Use AnyMap with any other charts.
AnyGantt 7.6.0 New Features
- Now a double-click on borders of data grid columns resets their width to the default value.
- Added the ability to draw the Baseline above the Actual, see API Reference for details.
- AnyGantt now supports formatting for Data Grid Columns, see API Reference for details.
AnyChart version history: https://www.anychart.com/products/anychart/history/
AnyMap version history: https://www.anychart.com/products/anymap/history/
AnyGantt version history: https://www.anychart.com/products/anygantt/history/
Trial download: https://www.anychart.com/download/
P.S. The set of ready-to-use maps is rather small for the moment, but we will add about a hundred maps in a week, and then the list will just keep growing.
- Categories: AnyChart Charting Component, AnyGantt, AnyMap, HTML5, JavaScript, News
- No Comments »
AnyMap News and Recap of the Week
July 26th, 2015 by Margaret SkomorokhGood news, everyone! We are putting finishing touches on the new AnyMap HTML5 engine, along with the new version of AnyChart with an amazing Theming Feature: ability to segregate settings and data once and till the end of times (if you wish to) and switch visual presets on-the-fly. And we are going to show the first demo of AnyStock HTML5 next week too.
Also, some interesting stuff we’ve encountered this week and covered on AnyChart Facebook Page:
We’ve noticed Line Charts in Age of Wonders III and Triumph Studios spotted that we were on the tutorial level.
Two great projects from the UK:
- Seeing Data: Making Sense of Data Through Visualisations is a research project which aims to understand how people make sense of data visualisations, the project is headed by Helen Kennedy, Professor of Digital Society at the Department of Sociological Studies, University of Sheffield.
- Compound Interest is a site that aims to take a closer look at the chemical compounds we come across on a day-to-day basis. It also provides graphics for educational purposes, both for teacher and student use. The site is run single-handedly by Andy Brunning, a chemistry teacher based in the UK who creates the graphics for the site in his spare time.
- Categories: AnyChart Charting Component, AnyMap, AnyStock, News
- No Comments »