AnyChart for Adobe Flex 3 – advanced chart and map component
February 29th, 2008 by Alex BatsuevAnyChart component for Adobe Flex 3 is now available!
Now Flex developers have better alternative of Flex Charting for adding interactive charts, maps and diagrams into their applications. Our solution allows to build dashboard, reporting, analytical, statistical, financial or any other data visualization solutions with Adobe Flex 3. AnyChart is an advanced Flash based data-visualizataion solution, allowing everyone to utilize power of animation and ultimate interactivity.
It’s just a beta 1 version and we are open for your opinions and suggestions.
You can send them as a comments to this post or contact us directly (support@anychart.com).
You can download SWC library from here:
http://6.anychart.com/products/anychart/docs/platforms/flex/AnyChartTrialSWCComponents.zip
And please take a look at the following samples:
Sample #1: Chart types.
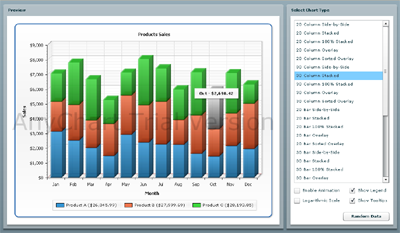
http://6.anychart.com/platforms/flex/samples/chartTypes/AnyChartFlexChartTypes.html
Source code of this sample is available here:
http://6.anychart.com/platforms/flex/samples/chartTypes/srcview/index.html
Sample #2: Sales map.
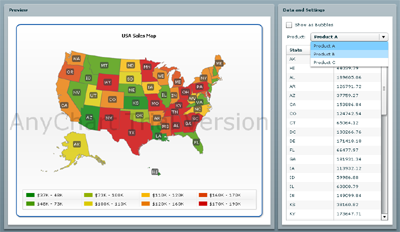
http://6.anychart.com/platforms/flex/samples/salesMap/AnyChartFlexSalesMap.html
Source code of this sample is available here:
http://6.anychart.com/platforms/flex/samples/salesMap/srcview/index.html
Sample #3: Yahoo Weather with AnyChart Flash Maps.
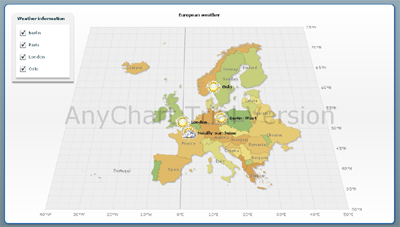
http://6.anychart.com/platforms/flex/samples/yahooWeather/YahooWeatherSample.html
Source code of this sample is available here:
http://6.anychart.com/platforms/flex/samples/yahooWeather/srcview/index.html
Quick start guide:
1. Download AnyChartFlexComponent.swc and add them to the “libs” folder of your project
2. Open your Flex application in the “Design” view.
3. Drag AnyCharFlex from Components panel to the stage (Custom->AnyChartFlex)
4. Open the “Code” view and write XML for the chart. e.g.
<ns1:AnyChartFlex x="10" y="10" width="550" height="400">
<ns1:anychartXML>
<mx:XML>
<anychart>
  <charts>
    <chart>
      <data>
        <series>
          <point name="pt1" y="10" />
          <point name="pt2" y="20" />
          <point name="pt3" y="30" />
          <point name="pt4" y="40" />
          <point name="pt5" y="20" />
        </series>
      </data>
    </chart>
  </charts>
</anychart>
</mx:XML>
</ns1:anychartXML>
</ns1:AnyChartFlex>
That’s it! Quick and Easy!
You can find complete XML reference here:
http://6.anychart.com/products/anychart/docs/xmlReference/index.html
Beta 1 provides full support of the AnyChart XML format, it means that all AnyChart features are available!
So – you are welcome to play with our demos and leave your comments! Your opinion is very important for us – Thank you!
- Categories: AnyChart Charting Component
- No Comments »
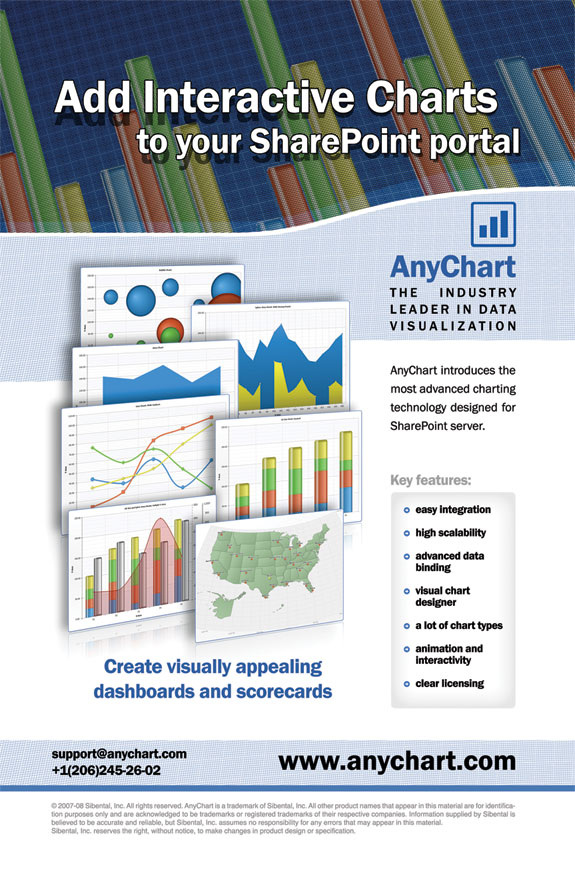
Add Interactive Charts to your Microsoft SharePoint portal
February 4th, 2008 by Anton BaranchukAnyChart announces new product – AnyChart for SharePoint!
That product will add advanced charting functionality to Microsoft SharePoint projects.
Key features:
– easy integration
– high scalability
– advanced data binding
– visual chart designer
– a lot of chart types
– animation and interactivity
– clear licensing
The product will be launched during March’08.
Interested in product? Want to participate in beta-testing program? Please contact us support@anychart.com
Create visually appealing dashboards and scorecards for SharePoint with AnyChart!
- Categories: AnyChart Charting Component
- No Comments »
AnyChart 4.2.1 Released – Featuring Custom Animation
January 31st, 2008 by Timothy LoginovOn January 31st, AnyChart Team is proud to present minor, but very interesting 4.2.1 release.
Now you can animate chart elements (lines, bars, points, etc.), elements labels and markers, you can set a different animation to each series, animate only certain point or label of certain point. For easy configuration you can use animation style – settings that can be reused for any element.
Also, we have updated the engine and now AnyChart works faster making possible plotting larger volumes of data.
Read more about available animation settings in AnyChart Chart Animation Tutorial in AnyChart User’s Guide.
Also, we have created a small Animation Playground, that allows you to pick an animation style, choose motion type, duration, etc. and preview how these settings will work, click to visit Animation Playground right now.
The new version can be downloaded from our site: Download fully functional trial version
Default animation for all chart types is shown in the AnyChart Flash Chart Gallery
Registered Customers can obtain new version from Customer Area.
New features allow to build visually appealing animated dashboards and reports!
- Categories: AnyChart Charting Component
- No Comments »
AnyChart 4.2.0 with interactive maps is now available!
December 30th, 2007 by Alex BatsuevWe’re happy to inform that new AnyMap Extension with a number of great features (including Charts and Maps in a single interactive dashboard) is available now.
AnyMap includes a lot of incredible unique features:
- Draw custom markers, bubbles, lines and connectors on the maps.
- Draw any map shipped in the package with no additional charge or royalty – see the list of available maps .
- Use any SHP file to create your custom map – contact us at contact@anychart.com for details.
- Display any map in one of ten map projections.
- Use geographical coordinates (longitude, latitude) to add custom points to the map.
- Use thresholds to color a map automatically, according to the data from your database.
- Add legend, labels and tooltips to a map.
- Attach custom actions to any map region – to create interactive web applications.
- Attach any custom data from your database to the map – for labels, tooltips, legend, coloring or actions.
- Display any data in any language (using UTF-8 char sets).
Now you can easily visualize any geographically related data to solve any of the following tasks:
- Create Drilldown Maps.
- Create Geographical Related Interactive Dashboards.
- Create RealEstate, Distributor, Franchise, Dealer, etc. locators.
- Visualize statistical or reporting data easily.
- Visualize marketing research reports.
- Create Area Selectors for web-sites.
Also AnyChart product includes some improvements and new features:
- Interactivity
– Multiple Elements Select
– Selectable/Hoverable Settings for Interactive Elements
– Title, Subtitle and Footer Actions
– updateView and updateChart tokens technique - Custom Controls with Fixed, Floating and Auto Layout
– Multiple Custom Interactive Labels
– Multiple Legends - Thresholds
– Custom condition based thresholds
– Automatic Thresholds - Exporting
– Save As PDF
– Save As Image now has export image size settings
– External invoking of Save As and Printing functions
– Autosaving a chart upon rendering - Axes
– Axes Custom Labels
– Axes Custom Lines (trends)
– Axes Custom Ranges (zones)
– New Axes Keywords
– New Extra Axes Definition Format - Templates
– ability to change series and data nodes attributes using template - No Data Message Configuration
- External showLoading commands and text configuration
- Massive AnyChart.js update
– https issues fix
– wmode parameter support
Please note that you can purchase AnyChart with AnyMap in bundle and save more than 25%.
Also our existing customers are welcome to contact us to get their personal discount coupon.
Useful links:
You can download AnyChart Flash Chart Component 4.2 with interactive maps here:
https://www.anychart.com/download/
Also you can look at the samples in our gallery:
http://6.anychart.com/products/anychart/gallery/
AnyChart Maps samples available here:
http://6.anychart.com/products/anychart/gallery/Interactive-Maps.php
Order page:
https://www.anychart.com/products/anymap/buy/
- Categories: AnyChart Charting Component
- No Comments »
Announce – new version with interactive maps
November 12th, 2007 by Anton BaranchukWe’re glad to announce new version of our charting component with new exciting chart type – geographical maps.
Interactive Maps is a unique feature of AnyChart component that allows you to visualize geo related data.
We use the same swf file to render maps and charts – it allows combining maps and chart in the interactive dashboard and easily deploying both of them.
The maps themselves are stored in a separate file with “*.amap” extension. You just place this file and swf file on your server and specify it in XML settings file to render a desired map.
Here are some tasks you can solve with AnyChart Flash Maps:
* Create Drilldown Maps.
* Create Geographical Related Dashboards.
* Create RealEstate, Distributor, Franchise, Dealer, etc. locators.
* Visualize statistical or reporting data easily.
* Visualize marketing research reports.
* Create Area Selectors for web-sites.
AnyChart Flash Map Features:
* Draw custom markers, bubbles, lines and connectors on the maps.
* Draw any map shipped in the package with no additional charge or royalty – see the list of available maps .
* Use any SHP file to create your custom map – if you have SHP files that contains maps you need – contact us at contact@anychart.com and we will convert them into AnyChart compatible format.
* Display any map in one of ten map projections.
* Use geographical coordinates (longitude, latitude) to add custom points to the map.
* Use thresholds to color a map automatically, according to the data stored in your database.
* Add legend, labels and tooltips to a map.
* Attach custom actions to any map region – to create interactive web applications.
* Attach any custom data from your database to the map – for labels, tooltips, legend, coloring or actions.

- Categories: AnyChart Charting Component
- 3 Comments »
AnyChart 4.1.1 – new version with the significant perfomance improvement
November 5th, 2007 by Anton BaranchukToday AnyChart programmers have released the new version – 4.1.1 with one very exciting improvement – the performance while loading the data. They say that some research work in the area of nanotechnology and the latest results in CPU engineering were involved 😉 and here it is – https://www.anychart.com/download/
Some tests with huge data sets show the improvement in 30 times – awesome! Now it is very fast!
Yes – I believe in nanotechnology and that words about CPU engineering, but I still think that we deal with some black magic here. 🙂
Of course it is a joke about nanotechnology, actually a lot of work was done to optimize the processing of data and tuning the loading of XML and we’ve got the result. I’m sure AnyChart users would appreciate that and like the new release.
- Categories: AnyChart Charting Component
- No Comments »
New article “Creating interactive digital dashboards from scratch” by Tim Loginov
October 29th, 2007 by Anton Baranchukhttp://6.anychart.com/products/anychart/docs/creating-dashboard-from-scratch.php
Like the instrument panel in a car, the computer version-dashboard displays critical info in easy-to-read graphics, assembled from data pulled in real time from corporate software programs. Dashboards deliver the detailed information needed by everyone for day-to-day decision-making. Simple yet powerful analysis allows any user to discover vital trends in business performance and continuously monitor the performance of your organization at all levels and in real time.
Dashboards provide your business with real-time business intelligence across all areas of your company – from accounting and sales, to fulfillment and support. The Dashboard offers instant snapshots of your designated key performance indicators (KPIs), and provides real-time trend graphs and ad hoc reports appropriate for each role in your business. With direct drill-down capability, you can move from a summary level directly to greater detail, and you can see real-time information to proactively manage for better results.
While most enterprise dashboards in production are probably still custom built, we provide you a new way of dashboard creation – using AnyChart Flash Component Dashboard mode. Since all charts created by AnyChart Flash Chart Component are rendered using a single swf file it is very easy to place such swf file to your web-site and provide it with an XML configuration file that configures a dashboard.
In this article we will create step-by-step a sample dashboard, at first – we will make a static one – that can be used for presentation purposes, and then – we will add interactivity, which makes dashboard a really useful and modern tool of business data analytics. We’ll go thought all steps from “paper-design” created by hand to the interactive Flash dashboard.


Read it here http://6.anychart.com/products/anychart/docs/creating-dashboard-from-scratch.php
This article was written by Tim Loginov as part of AnyChart Documentation.
- Categories: AnyChart Charting Component, Tips and Tricks
- No Comments »
Version 4.1.0 Released!
October 16th, 2007 by Alex BatsuevUpdate includes:
- Save As Image Feature
- New Chart Types:
- 3D Column (Range, Stacked, 100% Stacked),
- 3D Bar (Range, Stacked, 100% Stacked),
- 2D/3D Pyramid(Stacked, 100% Stacked ),
- 2D/3D Cone (Stacked, 100% Stacked),
- 2D/3D Cylinder(Range, Stacked, 100% Stacked).
- New Financial Chart Types:
- Japanese Candlestick,
- Open-High-Low-Close Chart.
- DateTime:
- X and Y Axes DateTime Scales with full control over labels and scale,
- Fully Customizable DateTime Formatting,
- Flexible DateTime Input/Output localization,
- UNIX TimeStamp Input Format,
- Scatter Charts with DateTime axes.
- Dashboard Creation Feature:
- Create Interactive Dashboard using powerfull layout, templates and actions system using only one SWF file.
- User’s Guide Updated:
- Over 80 tutorials with more than 300 chart samples,
- A number of Implementation Samples – including AJAX integration and JavaScript Event Handlers.
- XML Reference Updated.
- Interactivity:
- Unlimited Number of Custom Actions on Point Click – open web page, launch external function, update another chart in dashboard and drilldown.
- Selected State Configuration for All Chart Types, ability to set default selected element on chart.
- Color Range Palettes – automatic feature for coloring all data points in different colors.
- Preloader Texts Customization Feature
- Advanced Number Formatting and Scaling
- Ability to set Meta Data for Points and Series using Custom Attributes for use in labels, tooltips, legend and actions.
- Categories: AnyChart Charting Component
- No Comments »
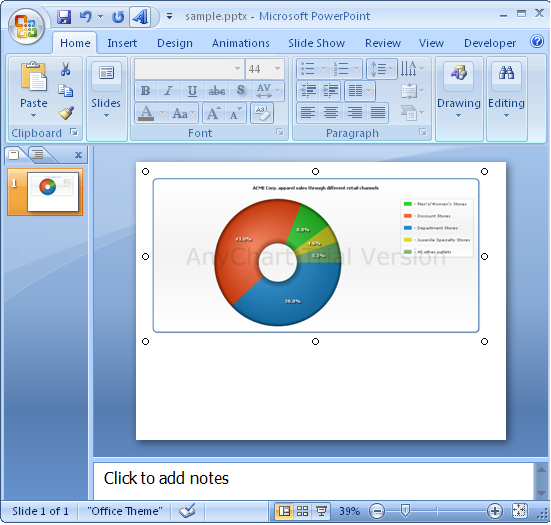
How to add Adobe Macromedia Flash content into Microsoft PowerPoint presentations
September 23rd, 2007 by Alex BatsuevIntegrating a Flash movie inside PowerPoint allows vector animation and interactivity to be added to a PowerPoint presentation. This strategy can be used to increase the performance. And it is really easy 😉
Here is a simple tutorial how to embed AnyChart into PowerPoint presentations:
Using AnyChart with PowerPoint presentations
- Categories: AnyChart Charting Component, Tips and Tricks
- 1 Comment »
New version – 4.0.6
September 23rd, 2007 by Alex BatsuevHi to everybody!
We’re happy to inform you about new release – 4.0.6
Update includes:
- Complete XML reference with all nodes
- Better gallery
- Some minor bug fixes:
- Now tokens {%DataPlotYMin} and {%DataPlotYMax} work in all texts and formats
- Fix for bug with X axes invert for Spline area series
- Some changes in XML:
- Data description for table legend was changed. New format is:
<item>
<attribute name=””></attribute>
…
</item> - Attributes x and y nodes <legend> were changed to ? horizontal_padding ? vertical_padding
- Data description for table legend was changed. New format is:
- Categories: AnyChart Charting Component
- No Comments »