New Data Visuals That Pull You In — DataViz Weekly
November 28th, 2025 by AnyChart Team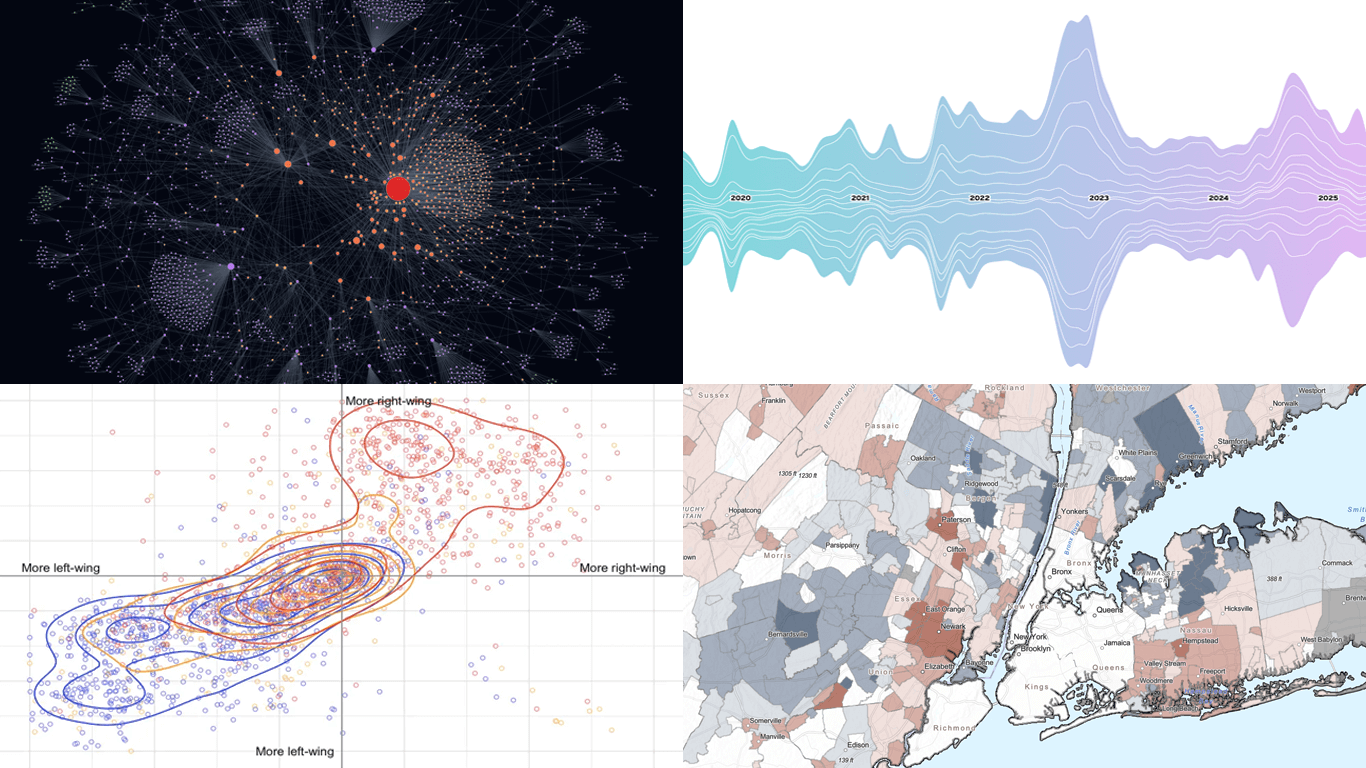 Some data visuals invite a closer look the moment they appear. We selected a set of fresh projects that have that effect and are happy to share them here in DataViz Weekly. Take a moment to explore the examples we picked for this edition:
- Trans media coverage patterns — Trans News Initiative
- Voters’ ideal political party positions — Strength In Numbers
- Epstein email network explorer — Max Andrews
- Fiscal inequality across the United States — Tax Base Fragmentation
- Categories: Data Visualization Weekly
- No Comments »
Enhancing AI-Assisted JavaScript Chart Development with Context7 MCP and Claude
November 26th, 2025 by AnyChart Team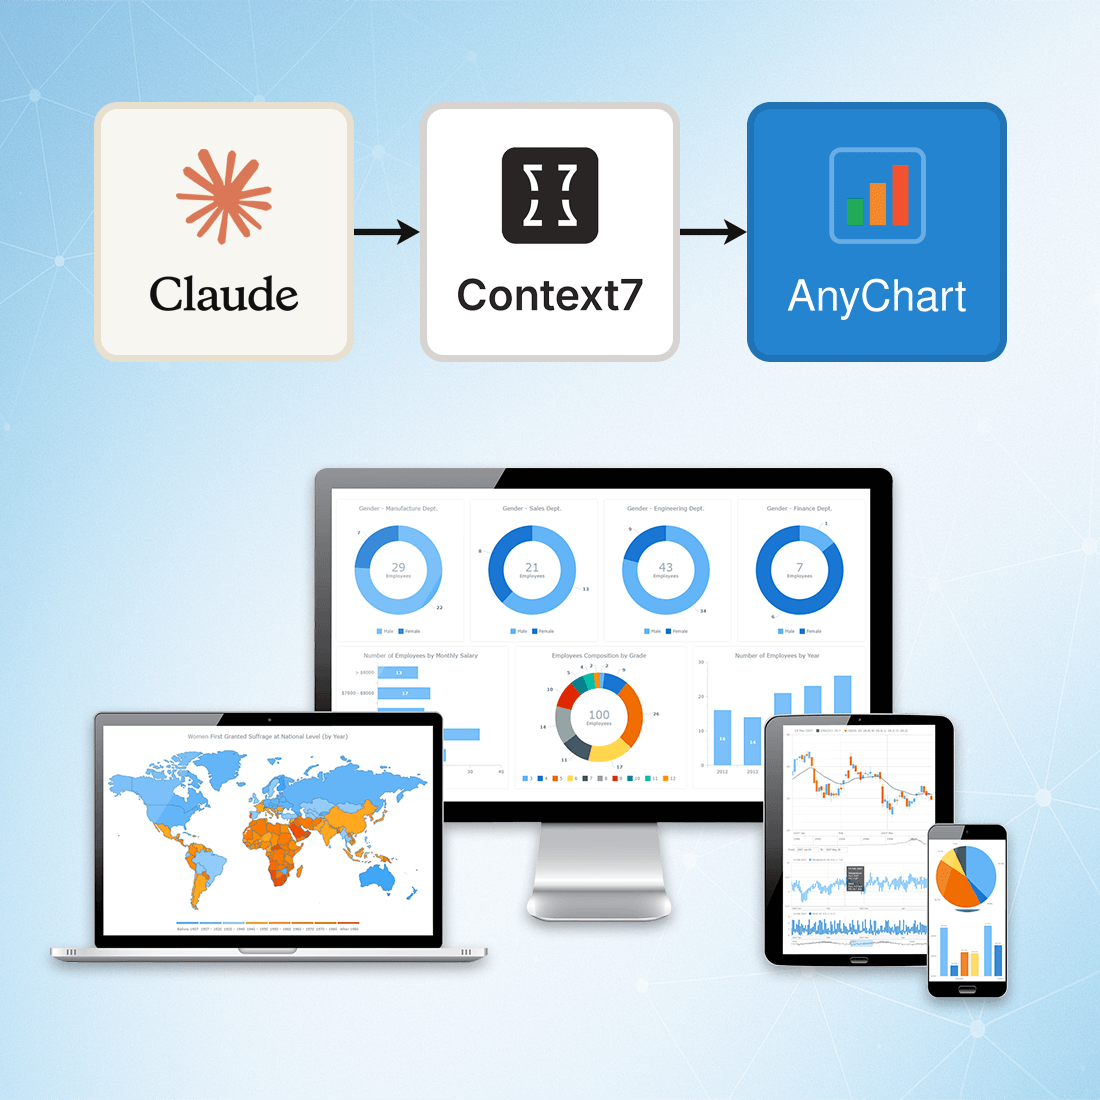 At AnyChart, we are constantly exploring tools and workflows that help developers work more efficiently, stay up to date, and minimize friction when integrating data visualization into their projects.
One approach we’ve recently tested — and found highly effective — is connecting Claude to Context7 via the Model Context Protocol (MCP). This integration gives Claude access to a continuously updated, extensive database of technical documentation across libraries, packages, and APIs.
This means you can rely on Claude not just for reasoning, but also for live, accurate, and authoritative documentation retrieval, dramatically reducing the chances of outdated suggestions or hallucinated methods.
- Categories: AnyChart Charting Component, AnyGantt, AnyMap, AnyStock, Big Data, Business Intelligence, Charts and Art, Dashboards, Financial Charts, Gantt Chart, GraphicsJS, HTML5, JavaScript, JS Chart Tips, News, Stock Charts, Third-Party Developers, Tips and Tricks
- No Comments »
Fresh Data Visualization Projects Worth a Look — DataViz Weekly
November 21st, 2025 by AnyChart Team Data visualization helps present information in a way that is easy to navigate. DataViz Weekly brings together recent projects that follow this idea. Here are four new ones we thought you would want to see:
- Neuroscience research topics over 50 years — The Transmitter
- Walking and cycling patterns worldwide — Scientific American
- Billionaire migration flows — Wesley Stubenbord
- Political content seen by new X users — Sky News
- Categories: Data Visualization Weekly
- No Comments »
Visualizing Data from Trade and Politics to Daily Life and Nature — DataViz Weekly
November 7th, 2025 by AnyChart Team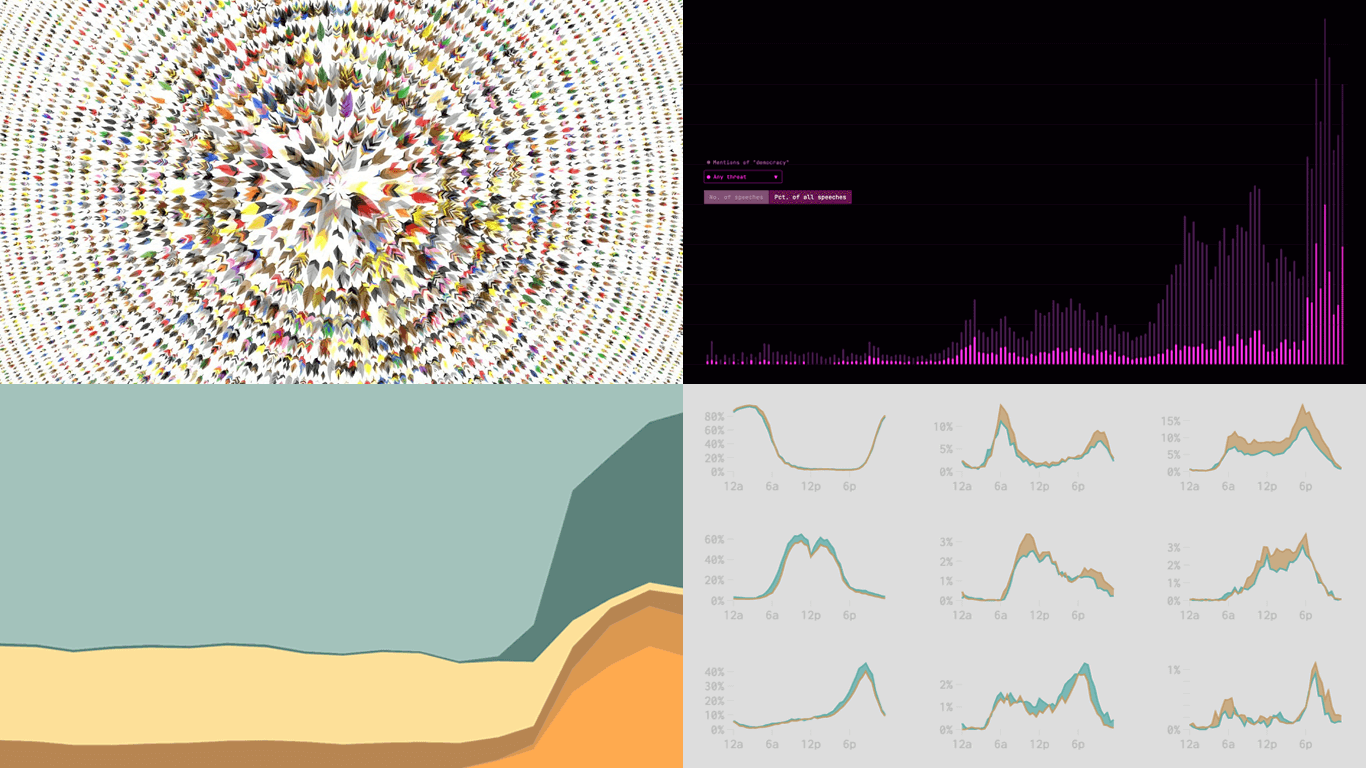 Every week we come across a variety of new data visuals out there and, through DataViz Weekly, put a spotlight on the ones we like most. Check out the latest edition, featuring:
- Talk of threats to democracy in the U.S. Congress — The Pudding
- Tariffs reshaping U.S. imports — The New York Times
- Daily activities of Americans by gender — FlowingData
- Birds as feathers — Jer Thorp
- Categories: Data Visualization Weekly
- No Comments »
Best JavaScript Gantt Chart Libraries in 2025–2026
November 5th, 2025 by Jay Stevenson Gantt charts are among the most effective ways to visualize tasks, timelines, and dependencies, making them a core component of modern project management practices. For developers building web applications, the right JavaScript Gantt chart library can dramatically save development time and deliver a professional, interactive experience directly in the browser.
The ecosystem in 2025–2026 includes a wide range of solutions — from free open-source libraries for simple timelines to enterprise-grade components with advanced scheduling engines and resource management features. Some prioritize speed and simplicity, while others focus on deep functionality and seamless integration into broader charting or UI stacks.
This article reviews the most notable JavaScript Gantt chart libraries available today. Each library is presented with its functionality, performance and scalability, integration options, licensing, and support. Whether you are building an internal tool, a SaaS application, or a full-scale enterprise system, this guide will help you quickly identify the Gantt solution that best fits your needs.
- Categories: AnyChart Charting Component, AnyGantt, Big Data, Business Intelligence, Dashboards, Gantt Chart, HTML5, JavaScript, Tips and Tricks
- No Comments »