New AI & Visualization Features for Data Analysis in Qlik Sense
October 31st, 2024 by AnyChart Team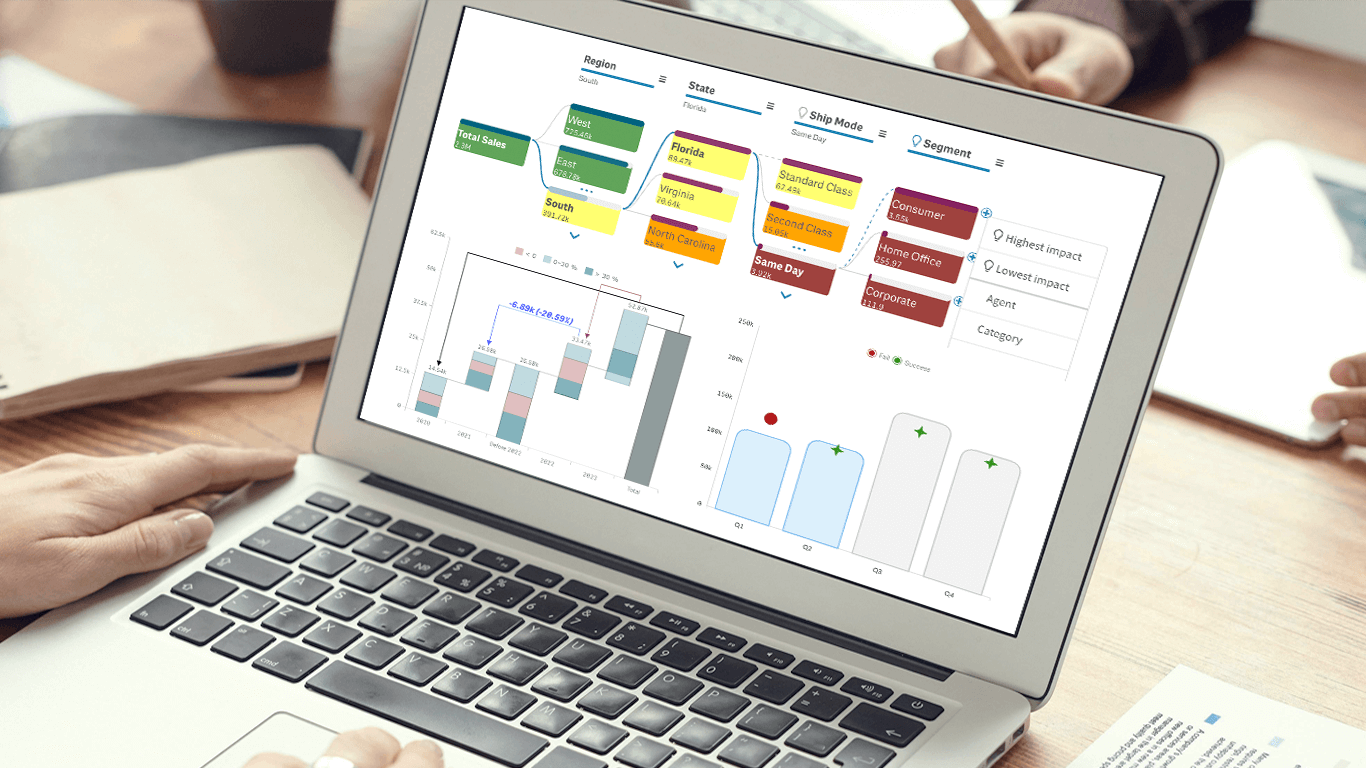 We’re excited to announce a series of updates to our extensions for Qlik Sense! They bring greater flexibility and precision to your data visualizations, allowing for uncovering deeper insights even more effectively. The most stunning new feature is AI Splits in the Decomposition Tree — let your users find the highest and lowest impacts with unprecedented speed!
Read on to learn what’s new at qlik.anychart.com »
- Categories: Big Data, Business Intelligence, News, Qlik
- No Comments »
Introducing AnyChart 8.13.0 for Elevated JavaScript Charting Experience
October 3rd, 2024 by AnyChart Team AnyChart 8.13.0 is now available, bringing a set of new features and improvements designed to further elevate your data visualization experience. In this release, we’ve focused on enhancing the Timeline, Waterfall, and Circle Packing charts in our JavaScript charting library, making them even more flexible and user-friendly. Read on to explore what’s new!
- Categories: AnyChart Charting Component, AnyGantt, AnyMap, AnyStock, Big Data, Business Intelligence, Dashboards, Financial Charts, Gantt Chart, HTML5, JavaScript, News, Stock Charts
- No Comments »
Introducing Updates to Waterfall Charts for Qlik Sense
February 1st, 2024 by AnyChart Team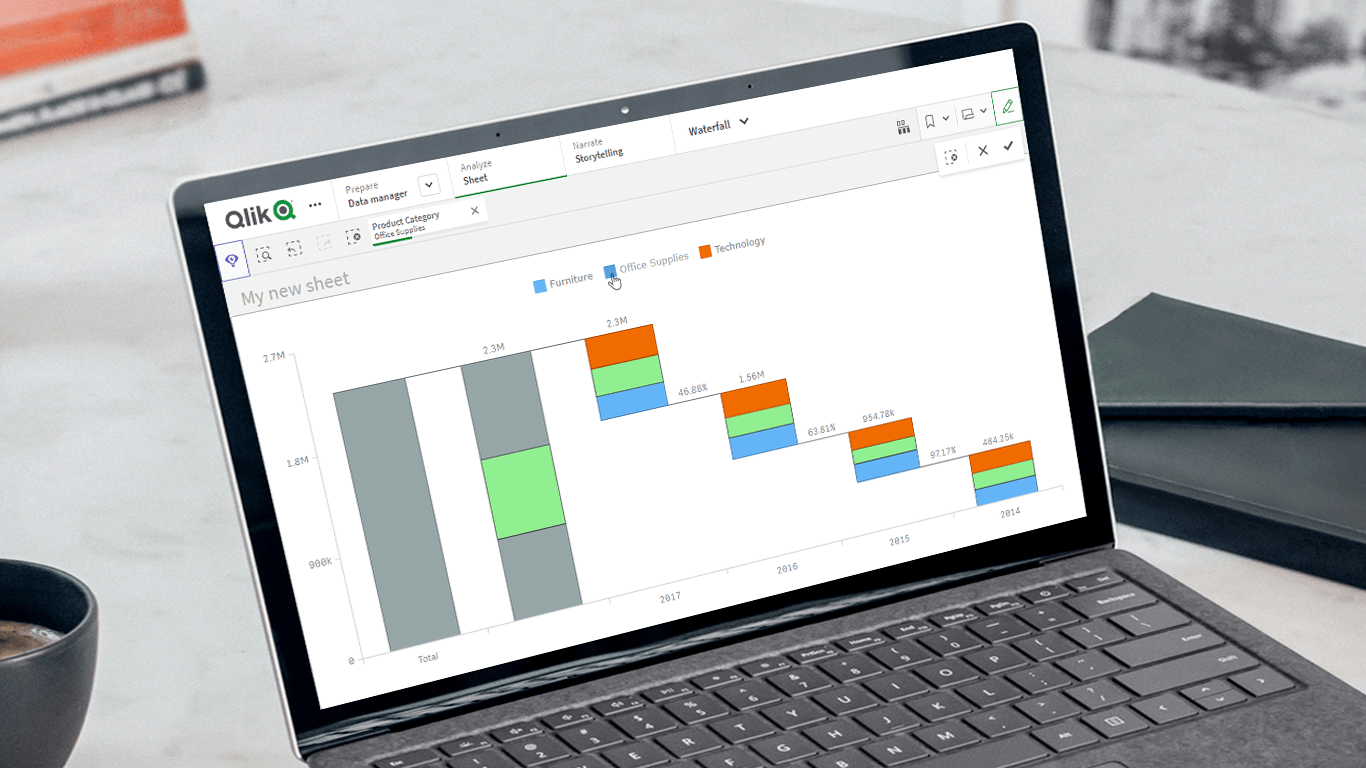 Unveiling the latest updates to our Waterfall Charts for Qlik Sense! In line with our commitment to empowering users to do more with Qlik, we’ve just added a set of new helpful features and improvements to our Waterfall Advanced and Waterfall Classic extensions. These enhancements are designed to further facilitate extracting valuable insights using stacked waterfall visualizations. Check out what’s in store!
Read more at qlik.anychart.com »
- Categories: Big Data, Business Intelligence, News, Qlik
- No Comments »
Building Waterfall Charts in JS
November 2nd, 2023 by Awan Shrestha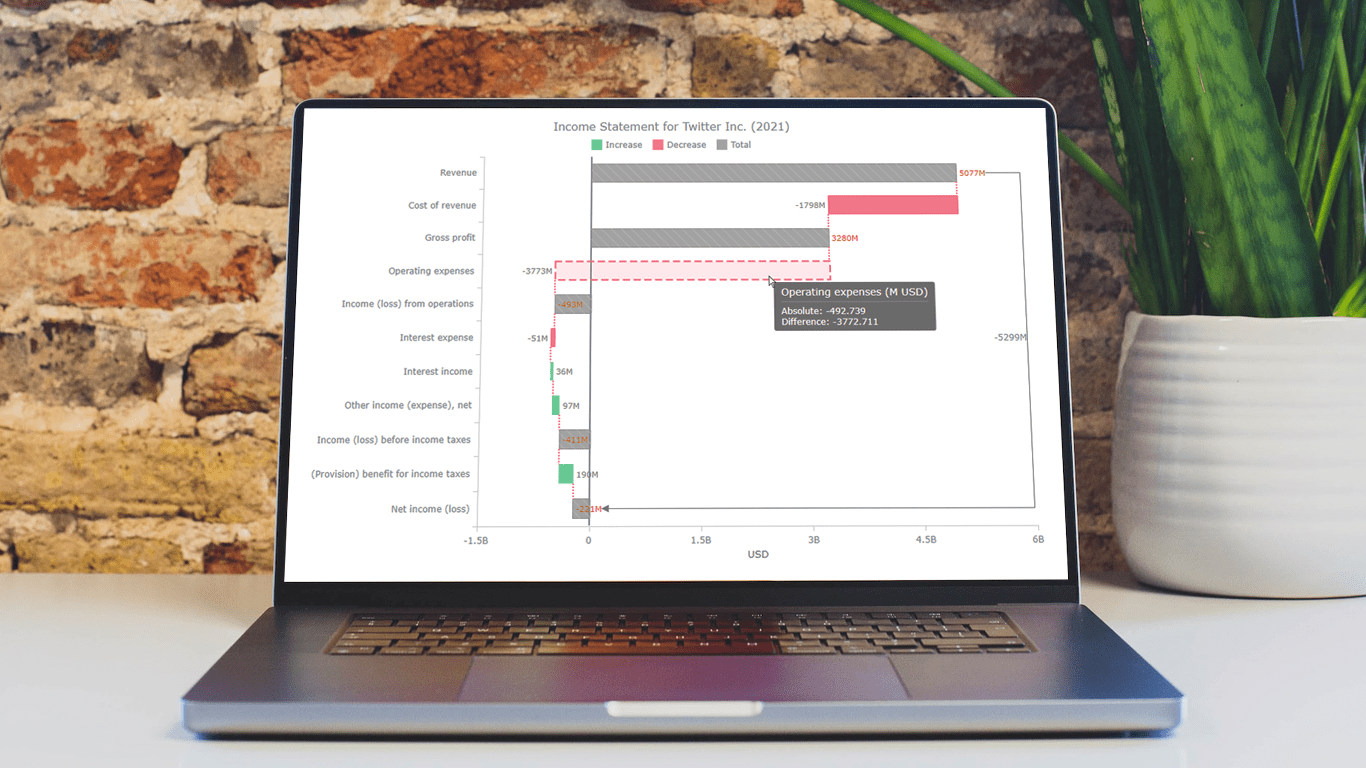 Data visualization is an essential tool for understanding complex data sets and effectively conveying insights. Among the various types of charts and graphs used for this purpose, the waterfall chart stands out as a powerful way to represent changes in financial data, such as revenue, expenses, and profits over a specific period.
In this tutorial, we'll explore how to create a waterfall chart using JavaScript. To illustrate the process, we'll use the example of an income statement for a company, in this case, Twitter Inc.’s latest (and last) one.
Whether it’s to analyze a company's financial performance, project budgets, or inventory fluctuations, this step-by-step guide will help you easily create a useful interactive JS-based waterfall chart.
Read the JS charting tutorial »
- Categories: AnyChart Charting Component, Big Data, Business Intelligence, HTML5, JavaScript, JavaScript Chart Tutorials, Tips and Tricks
- No Comments »
Deluxe Combo Chart & Versatile Circular Gauge for Qlik Sense
January 24th, 2023 by AnyChart Team In addition to the Decomposition Tree and new Gantt Chart features, we are excited to release two astonishing extensions. Enjoy making sense of your metrics using the brand new approaches you never had in Qlik before — with our Deluxe Combo Chart and Versatile Circular Gauge for Qlik Sense!
Now, join us for a quick overview of these novel extensions and check them out right away!
Read more at qlik.anychart.com »
- Categories: AnyChart Charting Component, Big Data, Business Intelligence, Dashboards, News, Qlik
- No Comments »
AnyChart JS Charts 8.11.0 Released with Awesome New Data Visualization Features
December 7th, 2021 by AnyChart Team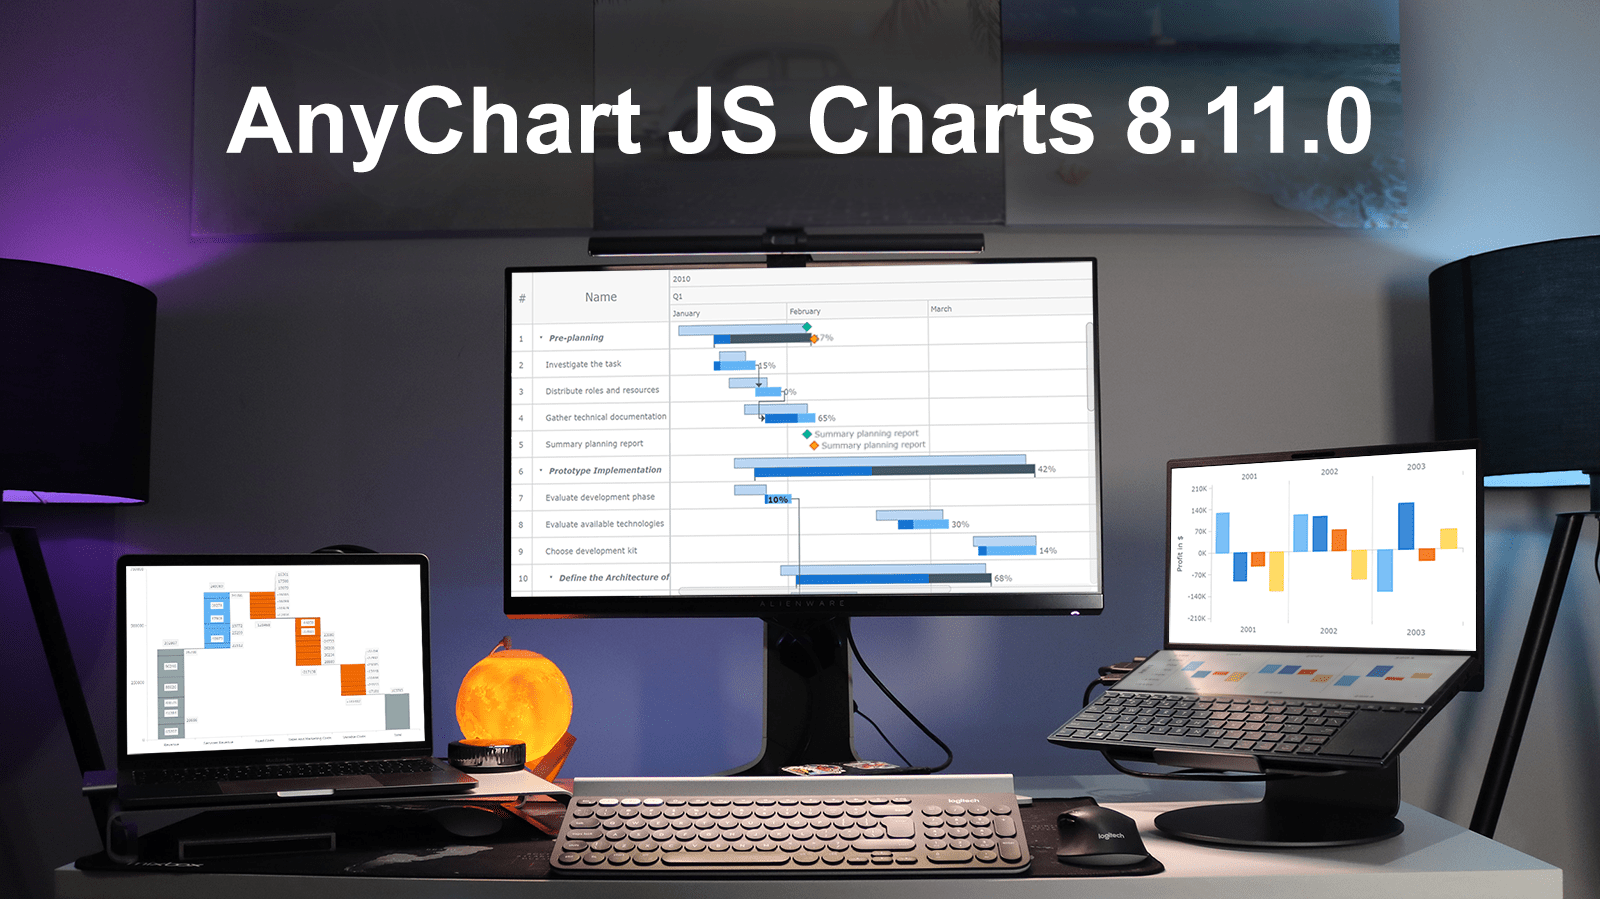 Excited to tell you we’ve just pushed a major update to our JavaScript charting library! The newly arrived features and improvements make our core solution even more flexible, adding awesome fresh capabilities designed to further help you on your data visualization development journey. Intrigued? Let us show what’s new in AnyChart JS Charts 8.11.0 right away!
»»» See What’s New in AnyChart 8.11.0! «««
- Categories: AnyChart Charting Component, AnyGantt, Gantt Chart, HTML5, JavaScript, News
- 3 Comments »
Stacked Waterfall Chart for Qlik Sense Upgraded
July 23rd, 2021 by AnyChart Team
You asked, and we listened. We have continued to work on plans to deliver an unprecedented experience with Waterfall Charts in Qlik Sense. And we are pleased to announce that several new valuable features are now there to improve the way you explore not only a by-category but also a by-subcategory breakdown of metrics!
Read below to see what’s new in our Stacked Waterfall Chart for Qlik Sense — just upgraded with the July release of the AnyChart Qlik Extension — and give it a try without delay!
Read more at qlik.anychart.com »
- Categories: AnyChart Charting Component, AnyGantt, Big Data, Business Intelligence, Gantt Chart, News, Qlik
- No Comments »
Creating Waterfall Chart with JS
March 16th, 2021 by Dilhani Withanage Do you want to know how to easily add a waterfall chart to a web page or application using JavaScript? This tutorial will make sure you’re prepared to confidently deal with that sort of interactive data visualization development!
Waterfall charts illuminate how a starting value turns into a final value over a sequence of intermediate additions (positive values) and subtractions (negative values). These additions and subtractions can be time-based or represent categories such as multiple income sources and expenditures. In finance, a waterfall chart is often called a bridge; you may have also heard it referred to as a cascade, Mario, or flying bricks chart.
To see waterfall charts in action and learn how to build them with JavaScript (HTML5), we need some interesting real-world data to visualize. In this tutorial, let’s look at the 2020 income statement for Alphabet Inc. (GOOGL), the parent company of Google.
Hence, be with me to reach our target step by step, so in the end, you’ll see how a lot of numbers can be made sense of with real ease when illustrated as a beautiful, interactive, JS waterfall chart. All aboard!
Read the JS charting tutorial »
- Categories: AnyChart Charting Component, Business Intelligence, HTML5, JavaScript, JavaScript Chart Tutorials, Tips and Tricks
- No Comments »
Meet September 2020 Releases of AnyChart and AnyGantt Extensions for Qlik
September 16th, 2020 by AnyChart Team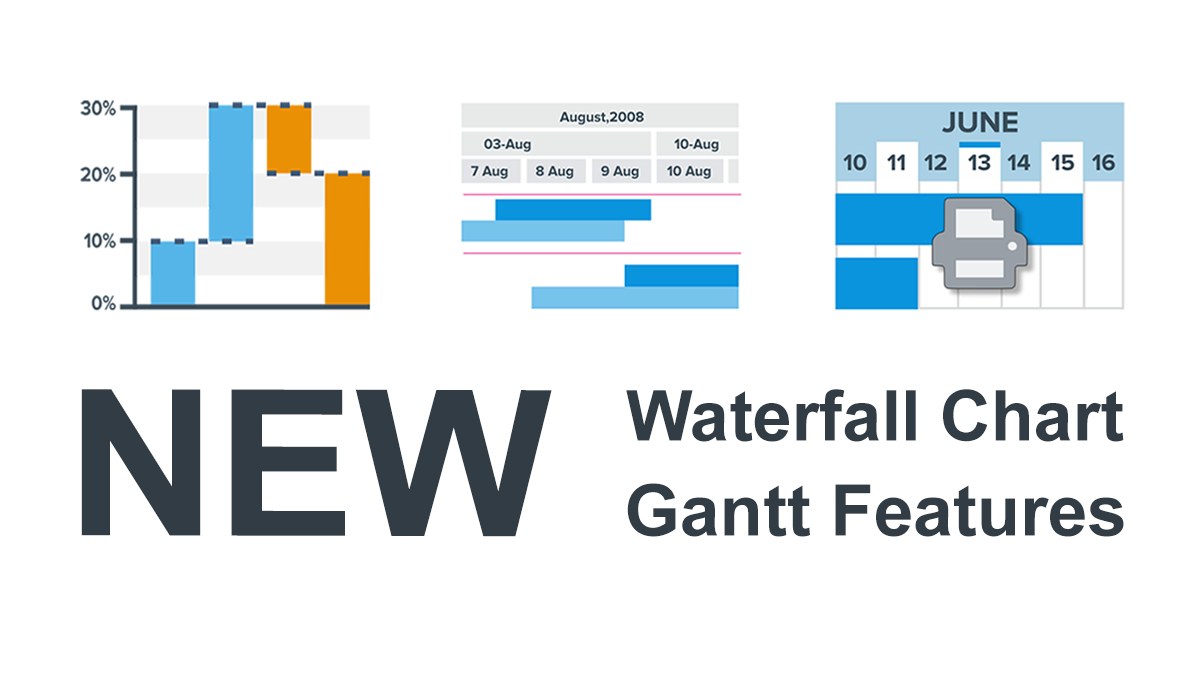 We’ve just updated the AnyChart and AnyGantt extensions for Qlik Sense to further facilitate the path to enhanced data-driven insights for you! Keep reading to learn about the new amazing Waterfall Chart and Gantt Chart features delivered in the 4.3.249 releases. Then check out the latest versions to see them all in action!
Read more at qlik.anychart.com »
- Categories: AnyChart Charting Component, AnyGantt, Big Data, Business Intelligence, Gantt Chart, News, Qlik
- No Comments »
AnyChart JavaScript Charting Libraries 7.14.0 Released: Can’t Stop Perfecting Data Visualization!
May 30th, 2017 by AnyChart Team![]() Here are the spring May flowers we promised. After the hard work put in over the past months, we’re happy to announce that the 7.14.0 release of our JavaScript charting libraries AnyChart, AnyStock, AnyMap, and AnyGantt is out and ready to download! It brings you new cool features and important improvements that will make your data visualization life even better.
Here are the spring May flowers we promised. After the hard work put in over the past months, we’re happy to announce that the 7.14.0 release of our JavaScript charting libraries AnyChart, AnyStock, AnyMap, and AnyGantt is out and ready to download! It brings you new cool features and important improvements that will make your data visualization life even better.
Now, we invite you to discover all the new JavaScript/HTML5 charting capabilities that the 7.14.0 version of AnyChart’s data visualization software product family has to offer to you. Here’s a quick overview…
- Categories: AnyChart Charting Component, AnyGantt, AnyMap, AnyStock, Business Intelligence, Dashboards, Financial Charts, Gantt Chart, HTML5, JavaScript, News, Stock Charts
- 7 Comments »