Top Data Visualizations on Travel, Burgers, Shootings, and Light — DataViz Weekly
August 9th, 2019 by AnyChart Team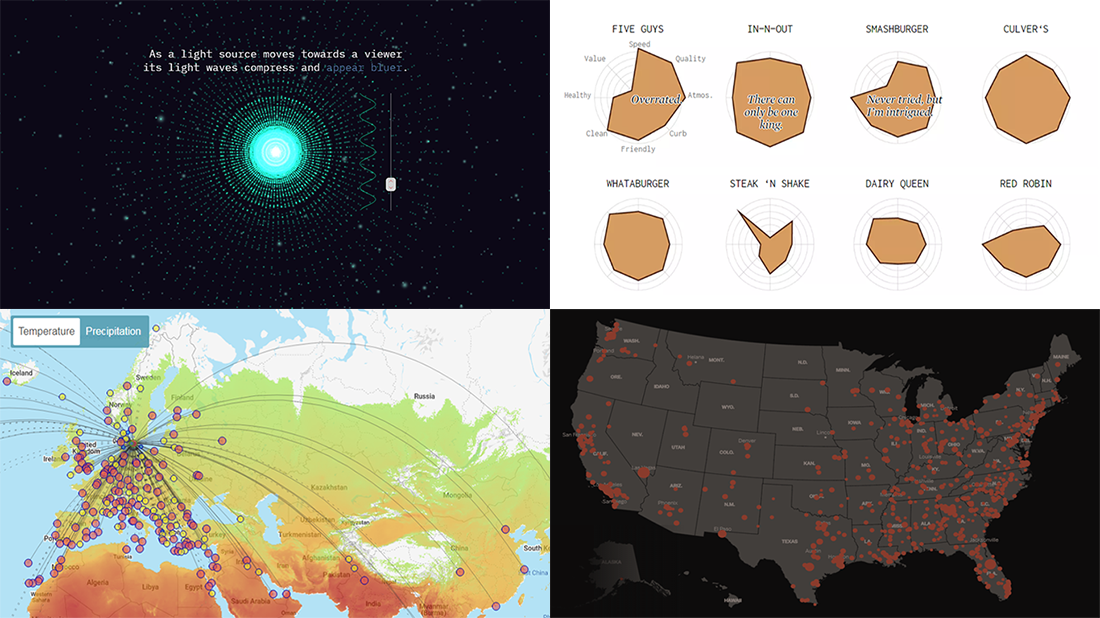 Greet a new post in the DataViz Weekly series, presenting new awesome, top data visualizations from various authors. Here’s what projects we’ve chosen to feature this time:
- Routitude, a smart map tool for travelers
- Fast-food burger restaurant rankings
- Mass shootings in the United States since Sandy Hook
- Using light from the center of the galaxy as a measure
- Categories: Data Visualization Weekly
- No Comments »