Interactive Technical Support Dashboard Created with AnyChart JavaScript (HTML5) Charts
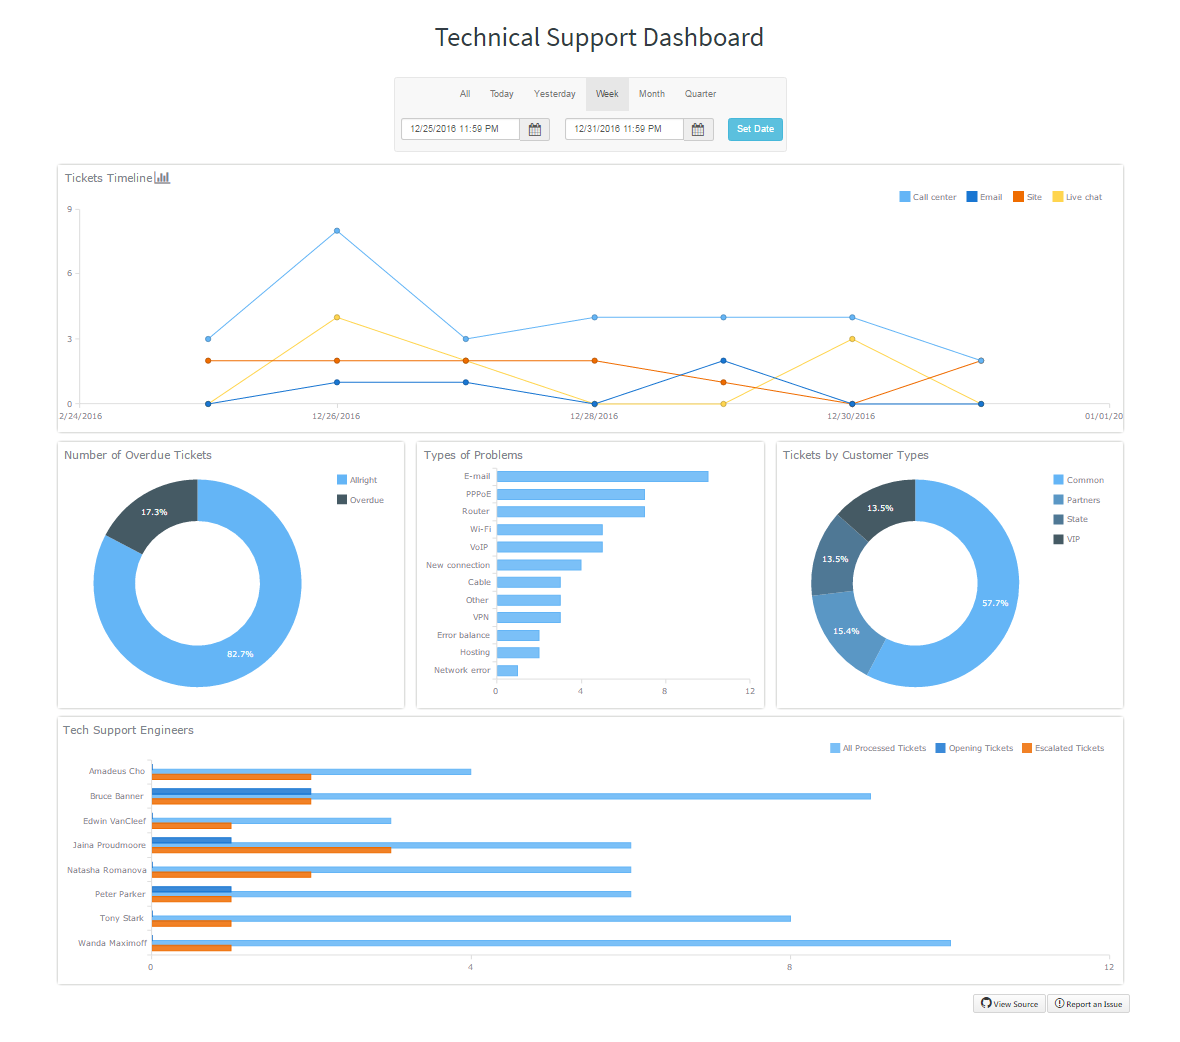
March 20th, 2017 by AnyChart Team Technical Support Dashboard is a great tool to keep track of all the support and related activities in your company. It can be very helpful in both monitoring your support team’s performance and revealing issue patterns in customer requests for further use by product strategy and development officers. And when you already have data, all you need is to decide how to visualize it, preferably quickly, easily, and fully compatibly with your own corporate software.
Now that the Web has completely adhered to the HTML5 standard, JavaScript charting libraries are the best type of solution for interactive data visualization. They can deliver all necessary dashboarding features and make the whole process of creating a dashboard for your web app pretty straightforward. Of course, you should just choose a right JavaScript charting library first that will entirely comply with your specific data visualization objectives.
But let’s get back to the very gist. Today we are glad to present the Technical Support Dashboard created with the JavaScript charting library of AnyChart. It is our new sample, available under the Apache 2.0 license, and you can feel free to make good use of it in your own business intelligence solutions. In particular, such a dashboard will help you fully control the support and make right data-driven decisions based on your data.
Now let’s take a closer look at this cool (and helpful) interactive JavaScript (HTML5) dashboard.
- Categories: AnyChart Charting Component, Business Intelligence, Dashboards, HTML5, JavaScript
- No Comments »
How to Choose the Right JavaScript Charting Component: 10 Factors You Have to Consider
March 5th, 2017 by AnyChart TeamCreating good data visualization is a huge investment of your time, but it’s also one of the most important things if you want to build a competitive, serious application. The best way to get consumers to see and feel your data is through pristine visualization, but choosing the best JavaScript charting library isn’t cut and dry. There are so many factors to consider when you’re thinking about JS charting.
Don’t fret! We’ve outlined some of the most important factors to consider when choosing a JS library. Here are 10 things you need to be thinking about right now.
- Categories: AnyChart Charting Component, Business Intelligence, Dashboards, HTML5, JavaScript
- 9 Comments »
HR Dashboard – Built With AnyChart JavaScript (HTML5) Charts Library
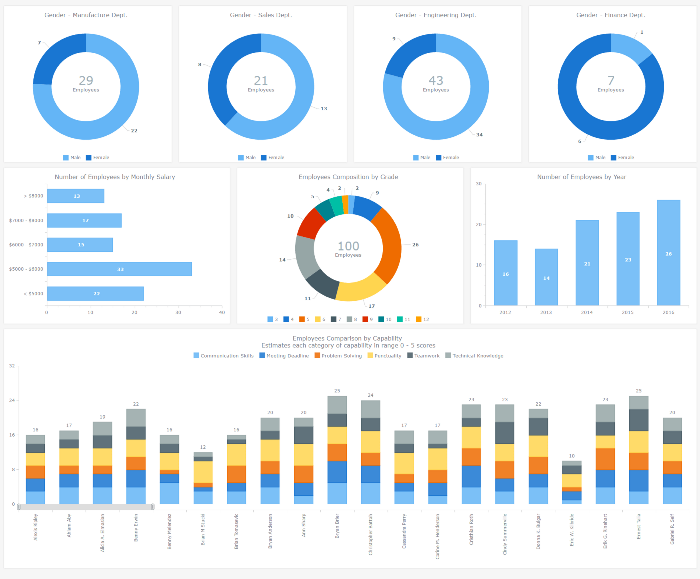
September 1st, 2016 by AnyChart TeamAn HR dashboard is a powerful BI solution that can mightily facilitate making right, data-driven decisions about the workforce in your company – from recruiting and training courses to compensations and job promotions. Smart visualization of all relevant staff-related data, with all charts and graphs on a single page, allows your Human Resources Department to see various metrics at-a-glance. As a result, HR managers are given the power to easily identify trends, outliers, and relationships when it comes to reports and data analysis, and to make sure each decision is well-timed and will drive even more success for your enterprise.
After all, it is the employees that are the most valuable asset.
To inspire and show you how easy it gets to implement this approach with the help of AnyChart JS Charts library, we added an interactive JavaScript-based Human Resources Dashboard to the Business Solutions section of our website as a new HTML5 business dashboard sample with the full source code. It nicely visualizes various employee related data, including demographics, payrolls, performance measurements, and so on. Of course, you are welcome to fork this sample and use our HR Dashboard fully or partially to create your own solution.
Now let’s have a closer look at this interactive HTML5 dashboard, including its composition and some peculiar features. Read more »
- Categories: AnyChart Charting Component, Business Intelligence, Dashboards, HTML5, JavaScript, News
- No Comments »

