Best JavaScript Gantt Chart Libraries in 2025–2026
November 5th, 2025 by Jay Stevenson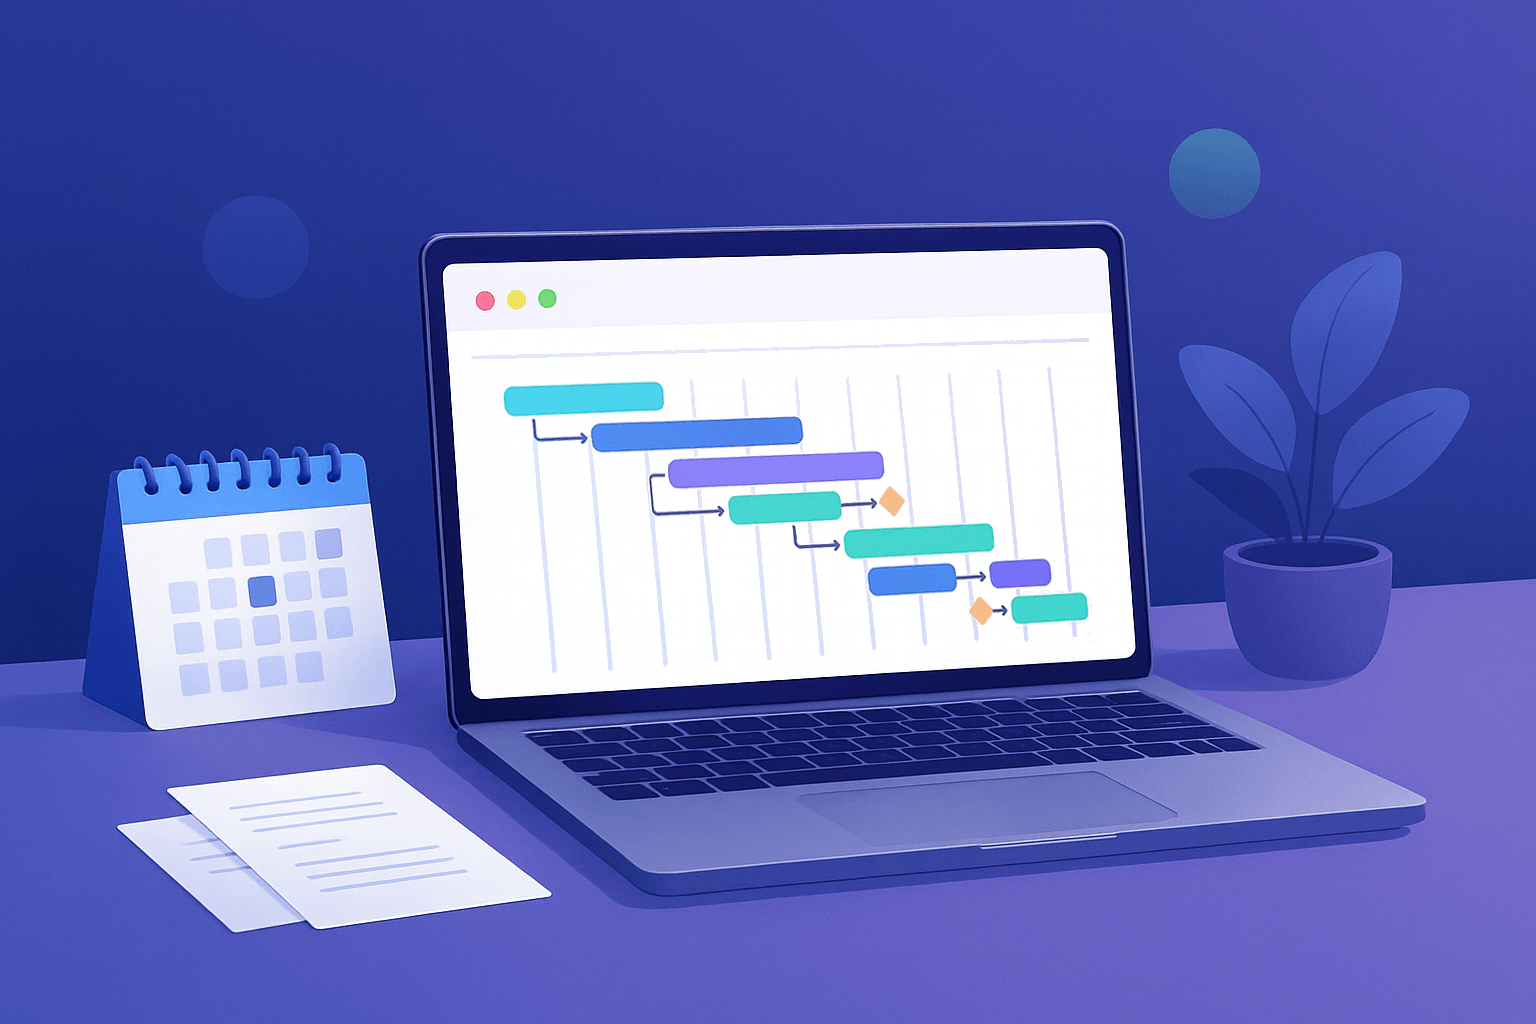 Gantt charts are among the most effective ways to visualize tasks, timelines, and dependencies, making them a core component of modern project management practices. For developers building web applications, the right JavaScript Gantt chart library can dramatically save development time and deliver a professional, interactive experience directly in the browser.
The ecosystem in 2025–2026 includes a wide range of solutions — from free open-source libraries for simple timelines to enterprise-grade components with advanced scheduling engines and resource management features. Some prioritize speed and simplicity, while others focus on deep functionality and seamless integration into broader charting or UI stacks.
This article reviews the most notable JavaScript Gantt chart libraries available today. Each library is presented with its functionality, performance and scalability, integration options, licensing, and support. Whether you are building an internal tool, a SaaS application, or a full-scale enterprise system, this guide will help you quickly identify the Gantt solution that best fits your needs.
- Categories: AnyChart Charting Component, AnyGantt, Big Data, Business Intelligence, Dashboards, Gantt Chart, HTML5, JavaScript, Tips and Tricks
- No Comments »
Stunning New Charts & Maps from Around Internet — DataViz Weekly
October 4th, 2024 by AnyChart Team Charts and maps have a unique power to let data talk, transforming raw numbers into meaningful insights that anyone can grasp. In this edition of DataViz Weekly, we’re featuring some of the most stunning new examples of how data visualization brings information to life.
- Hazard-prone locations in the United States attracting migration — NYT
- Shifts in college admissions after the affirmative action ruling — Bloomberg
- Google search trends around U.S. elections — Google Trends and Truth & Beauty
- Interactive timeline of Roman history — AnyChart
- Categories: Data Visualization Weekly
- No Comments »
Creating Timeline Chart of Roman History Using JavaScript
October 3rd, 2024 by AnyChart Team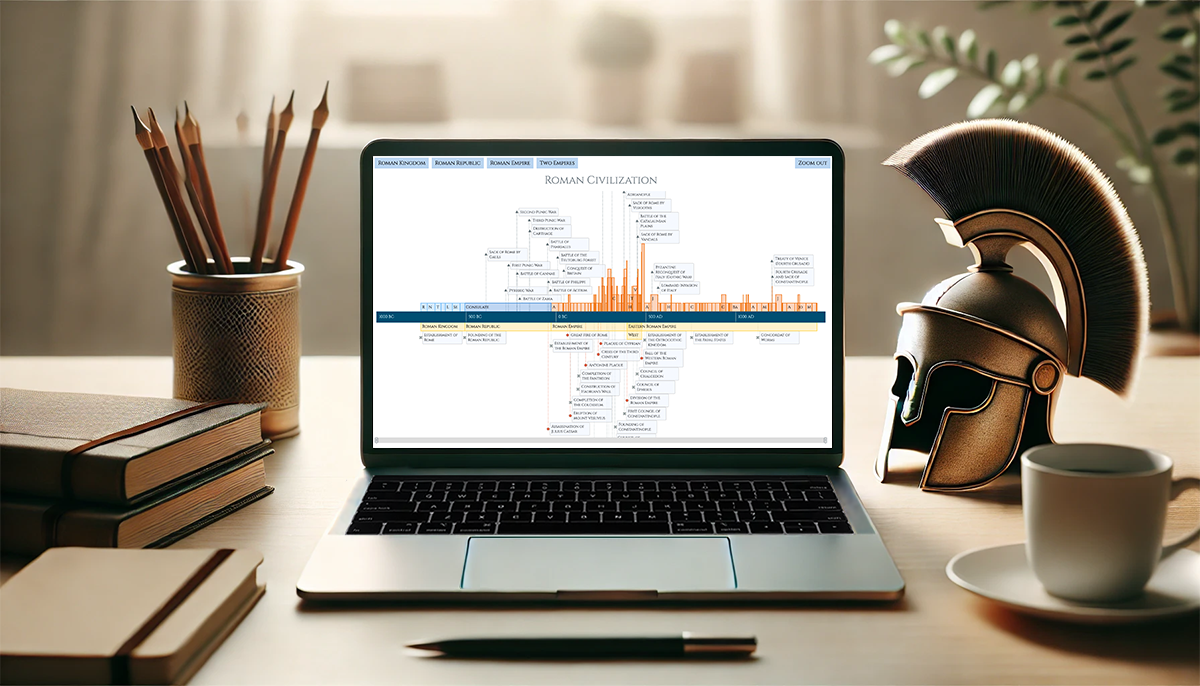 Ever caught yourself thinking about the Roman Empire more often than you’d like to admit? You’re not alone, and we’ve got just the thing for you! With the recent AnyChart JS Charts 8.13.0 release, we’ve enhanced our timeline chart for better support of historical data visualization. We’d love to showcase this improvement in action.
We’ve added a Roman History Timeline to our gallery of timeline chart examples, and we now invite you to discover how it was developed from scratch. In this in-depth JavaScript charting tutorial, we’ll cover everything from A to Z, meticulously guiding you through each step — from setting up the HTML environment to adding detailed data and customizing the visualization to make the chart both informative and engaging. The final result is an interactive timeline that you can proudly call your own Roman Empire.
So, whether you’re a history enthusiast caught up in the recent meme trend or a developer eager to expand your data visualization skills, follow along and learn how to create compelling historical timeline charts using JavaScript!
Read the JS charting tutorial »
- Categories: AnyChart Charting Component, Big Data, HTML5, JavaScript, JavaScript Chart Tutorials, Tips and Tricks
- No Comments »
Introducing AnyChart 8.13.0 for Elevated JavaScript Charting Experience
October 3rd, 2024 by AnyChart Team AnyChart 8.13.0 is now available, bringing a set of new features and improvements designed to further elevate your data visualization experience. In this release, we’ve focused on enhancing the Timeline, Waterfall, and Circle Packing charts in our JavaScript charting library, making them even more flexible and user-friendly. Read on to explore what’s new!
- Categories: AnyChart Charting Component, AnyGantt, AnyMap, AnyStock, Big Data, Business Intelligence, Dashboards, Financial Charts, Gantt Chart, HTML5, JavaScript, News, Stock Charts
- No Comments »
AnyChart Named Best in Data Analytics & Visualization ?
February 3rd, 2023 by AnyChart Team We’re proud to announce that AnyChart has won a prestigious 2023 DEVIES Award in the Data Analytics & Visualization category! Many thanks to the jury and congratulations to all our partners and customers!
Celebrating 20 years in the market this year, we at AnyChart have been working hard to develop the best-in-class data visualization solutions. And we will keep innovating and excelling!
The DEVIES Awards are the definitive annual awards for the software industry, recognizing outstanding design, engineering, and innovation in developer technology across multiple categories. This year’s winners were selected from record-high hundreds of nominations by an expert-led panel of the DevNetwork Advisory Board, including representatives of Accenture, DigitalOcean, EA, Google, IBM, Salesforce, and other great companies.
- Categories: AnyChart Charting Component, AnyGantt, AnyMap, AnyStock, Big Data, Business Intelligence, Dashboards, Financial Charts, Gantt Chart, GraphicsJS, HTML5, JavaScript, News, Oracle Apex, Qlik, Stock Charts, Success Stories
- 2 Comments »
How to Make Timeline Chart (in JavaScript)
August 4th, 2022 by Shachee Swadia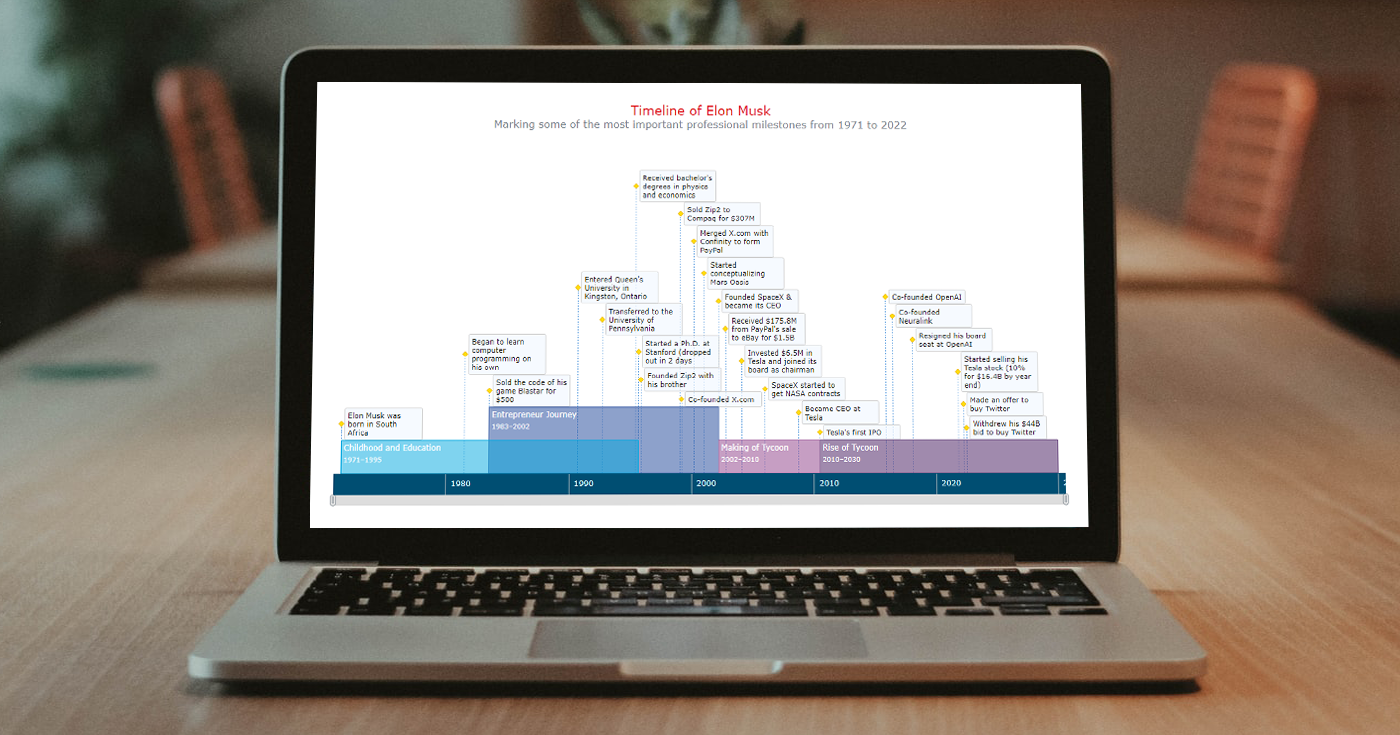 A timeline chart is an excellent way to represent important events and periods in chronological order. Now, let me teach you how to easily create an elegant interactive visualization like that using JavaScript!
To make this tutorial both helpful and entertaining, I decided to take real data. Join me as I visualize the life of Elon Musk in a JS timeline chart step by step, focusing on the most important events in his career as an entrepreneur and investor.
Read the JS charting tutorial »
- Categories: AnyChart Charting Component, HTML5, JavaScript, JavaScript Chart Tutorials, Tips and Tricks
- No Comments »