 A timeline chart is an excellent way to represent important events and periods in chronological order. Now, let me teach you how to easily create an elegant interactive visualization like that using JavaScript!
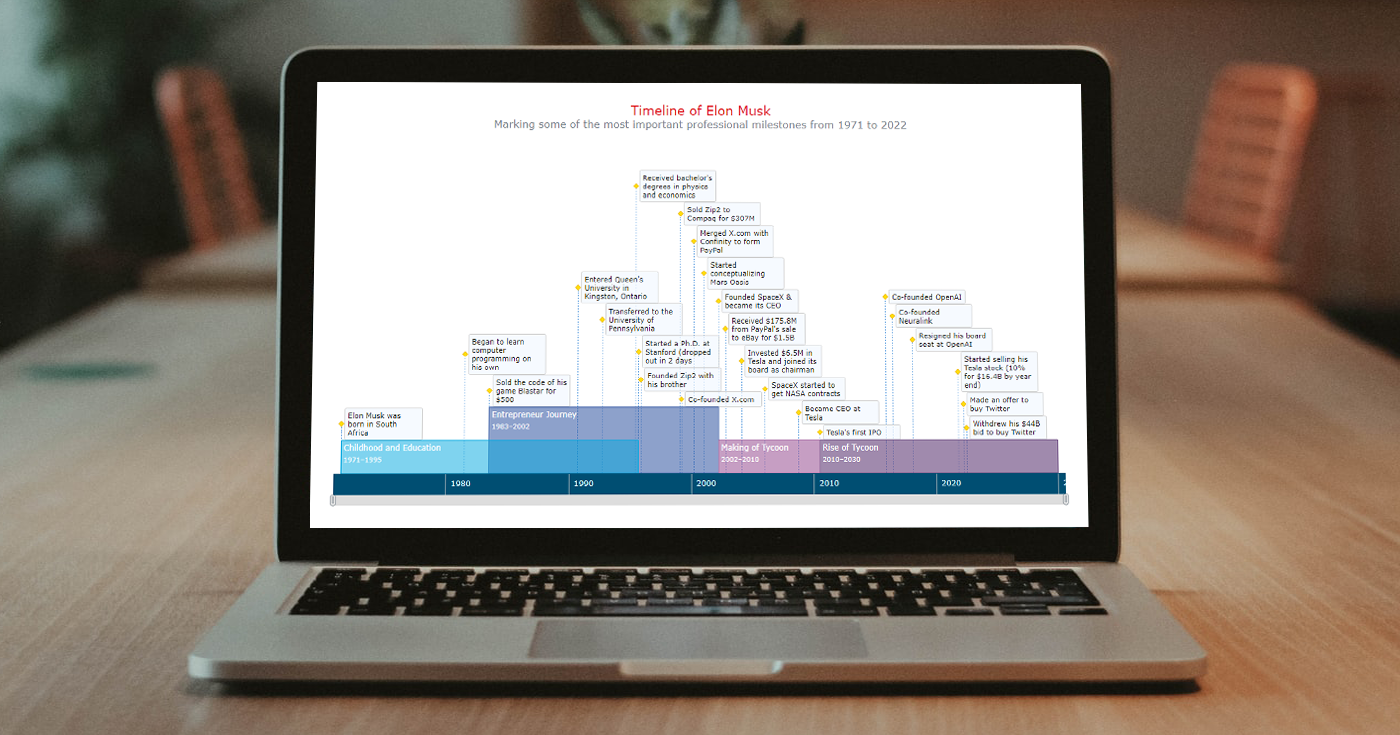
To make this tutorial both helpful and entertaining, I decided to take real data. Join me as I visualize the life of Elon Musk in a JS timeline chart step by step, focusing on the most important events in his career as an entrepreneur and investor.
Timeline Chart Preview
Take a look at the beautiful JavaScript timeline chart that I will be creating along the tutorial, and keep reading to find out how!
4 Steps to Build Basic JS Timeline Chart
Creating an interactive JavaScript-based timeline chart, even a basic one, may seem to be a daunting task. But right now, you’ll see how to do it with ease.
In this tutorial, the process of building a JS timeline chart is split into four steps: creating a web page, adding scripts, setting data, and configuring the visualization.
A stunning basic timeline chart will be arranged in just a few lines of easy-to-comprehend code. Then I will show you how it can be customized (also without much complexity). Follow me!
1. Creating a web page
First, I make a simple web page with an HTML block element. That’s where my JavaScript-based timeline chart will appear.
I provide this element with an ID and set its height and weight as 100% so that the visualization takes the entire page.
<html>
  <head>
    <title>JavaScript Timeline Chart</title>
    <style type="text/css">
      html, body, #container {
        width: 100%; height: 100%; margin: 0; padding: 0;
      }
    </style>
  </head>
  <body>
    <div id="container"></div>
  </body>
</html>
2. Adding scripts
Second, I add all scripts I am going to build a timeline chart with to the <head> section of the HTML page.
In this tutorial, I will be using AnyChart JS Charts, a robust JavaScript charting library with vast out-of-the-box capabilities that make it easy to quickly visualize data in dozens of chart types including timelines.
Here, I need the Core and Timeline modules.
<html>
  <head>
    <title>JavaScript Timeline Chart</title>
    <script src="https://cdn.anychart.com/releases/8.11.0/js/anychart-core.min.js"></script>
    <script src="https://cdn.anychart.com/releases/8.11.0/js/anychart-timeline.min.js"></script>
    <style type="text/css">
      html, body, #container {
        width: 100%; height: 100%; margin: 0; padding: 0;
      }
    </style>
  </head>
  <body>
    <div id="container"></div>
    <script>
      // All the JS code for the timeline chart will go here.
    </script>
  </body>
</html>
3. Setting data
Third, I set the data I want to visualize in a JS timeline chart.
There will be two series of different types, range and moment. Each will be added through a separate function.
The range series is for periods. Each data point has a name along with start and end dates.
function rangeData() {
  return [
    {
      name: "Childhood and Education",
      start: "1971/06/28",
      end: "1995/09/01"
    },
    {
      name: "Entrepreneur Journey",
      start: "1983/06/28",
      end: "2002/03/13"
    },
    {
      name: "Making of Tycoon",
      start: "2002/03/14",
      end: "2010/06/28"
    },
    {
      name: "Rise of Tycoon",
      start: "2010/06/29",
      end: "2030/01/01"
    }
  ];
}
The moment series is for individual events. Each data point has a date and text.
function momentData() {
  return [
    ["1971/06/28", "Elon Musk was born in South Africa"],
    ["1981/06/28", "Began to learn computer programming on his own"],
    ["1983/06/28", "Sold the code of his game Blastar for $500"],
    ["1990/09/01", "Entered Queen's University in Kingston, Ontario"],
    ["1992/09/01", "Transferred to the University of Pennsylvania"],
    ["1995/06/01", "Received bachelor's degrees in physics and economics"],
    ["1995/09/01", "Started a Ph.D. at Stanford (dropped out in 2 days"],
    ["1995/11/06", "Founded Zip2 with his brother"],
    ["1999/02/01", "Sold Zip2 to Compaq for $307M"],
    ["1999/03/01", "Co-founded X.com"],
    ["2000/03/01", "Merged X.com with Confinity to form PayPal"],
    ["2001/01/01", "Started conceptualizing Mars Oasis"],
    ["2002/03/14", "Founded SpaceX & became its CEO"],
    ["2002/10/03", "Received $175.8M from PayPal's sale to eBay for $1.5B"],
    ["2004/02/01", "Invested $6.5M in Tesla and joined its board as chairman"],
    ["2006/01/01", "SpaceX started to get NASA contracts"],
    ["2008/10/01", "Became CEO at Tesla"],
    ["2010/06/29", "Tesla's first IPO"],
    ["2015/12/11", "Co-founded OpenAI"],
    ["2016/07/01", "Co-founded Neuralink"],
    ["2018/02/21", "Resigned his board seat at OpenAI"],
    ["2021/11/06", "Started selling his Tesla stock (10% for $16.4B by year end)"],
    ["2022/04/13", "Made an offer to buy Twitter"],
    ["2022/07/08", "Withdrew his $44B bid to buy Twitter"]
  ];
}
Alright! We’ve got a page, scripts, and data ready. Now, it’s time to add some JavaScript charting code to complete the intended interactive timeline chart visualization!
4. Configuring the visualization
To start with, we add the data from the previous step. Then we use a function to ensure that our subsequent code configuring the timeline chart is executed when the web page is already loaded.
<script>

  // set the range series data
  function rangeData() {
    return [
      {
        name: "Childhood and Education",
        start: "1971/06/28",
        end: "1995/09/01"
      },
      {
        name: "Entrepreneur Journey",
        start: "1983/06/28",
        end: "2002/03/13"
      },
      {
        name: "Making of Tycoon",
        start: "2002/03/14",
        end: "2010/06/28"
      },
      {
        name: "Rise of Tycoon",
        start: "2010/06/29",
        end: "2030/01/01"
      }
    ];
  }

  // set the moment series data
  function momentData() {
    return [
      ["1971/06/28", "Elon Musk was born in South Africa"],
      ["1981/06/28", "Began to learn computer programming on his own"],
      ["1983/06/28", "Sold the code of his game Blastar for $500"],
      ["1990/09/01", "Entered Queen's University in Kingston, Ontario"],
      ["1992/09/01", "Transferred to the University of Pennsylvania"],
      ["1995/06/01", "Received bachelor's degrees in physics and economics"],
      ["1995/09/01", "Started a Ph.D. at Stanford (dropped out in 2 days"],
      ["1995/11/06", "Founded Zip2 with his brother"],
      ["1999/02/01", "Sold Zip2 to Compaq for $307M"],
      ["1999/03/01", "Co-founded X.com"],
      ["2000/03/01", "Merged X.com with Confinity to form PayPal"],
      ["2001/01/01", "Started conceptualizing Mars Oasis"],
      ["2002/03/14", "Founded SpaceX & became its CEO"],
      ["2002/10/03", "Received $175.8M from PayPal's sale to eBay for $1.5B"],
      ["2004/02/01", "Invested $6.5M in Tesla and joined its board as chairman"],
      ["2006/01/01", "SpaceX started to get NASA contracts"],
      ["2008/10/01", "Became CEO at Tesla"],
      ["2010/06/29", "Tesla's first IPO"],
      ["2015/12/11", "Co-founded OpenAI"],
      ["2016/07/01", "Co-founded Neuralink"],
      ["2018/02/21", "Resigned his board seat at OpenAI"],
      ["2021/11/06", "Started selling his Tesla stock (10% for $16.4B by year end)"],
      ["2022/04/13", "Made an offer to buy Twitter"],
      ["2022/07/08", "Withdrew his $44B bid to buy Twitter"]
    ];
  }

  anychart.onDocumentReady(function() {
    // The (following) timeline charting code lands here.
  });

</script>
Then, within the anychart.onDocumentReady() function, I create a timeline chart instance using the timeline() function, set both series, and make the range series labels display the name attribute.
// create a timeline chart
let chart = anychart.timeline();

// create a range series
let rangeSeries = chart.range(rangeData());

// create a moment series
let momentSeries = chart.moment(momentData());

// configure the range series label settings
rangeSeries.labels().format("{%name}");
Also right there, I add a few more lines to entitle the timeline chart, define a container for it, and finally, command to draw the resulting graphic.
// set the chart title
chart.title("Timeline of Elon Musk");

// set the chart container id
chart.container("container");

// draw the chart
chart.draw();
Result: Basic JS Timeline Chart
There you go! A cool interactive JavaScript timeline chart visualization is ready. And it has been far from difficult to build one, hasn’t it?
Here’s the complete code for this timeline chart. It is also available on AnyChart Playground.
<html>
  <head>
    <title>JavaScript Timeline Chart</title>
    <script src="https://cdn.anychart.com/releases/8.11.0/js/anychart-core.min.js"></script>
    <script src="https://cdn.anychart.com/releases/8.11.0/js/anychart-timeline.min.js"></script>
    <style type="text/css">
      html, body, #container {
        width: 100%; height: 100%; margin: 0; padding: 0;
      }
    </style>
  </head>
  <body>
    <div id="container"></div>
    <script>

      // set the range series data
      function rangeData() {
        return [
          {
            name: "Childhood and Education",
            start: "1971/06/28",
            end: "1995/09/01"
          },
          {
            name: "Entrepreneur Journey",
            start: "1983/06/28",
            end: "2002/03/13"
          },
          {
            name: "Making of Tycoon",
            start: "2002/03/14",
            end: "2010/06/28"
          },
          {
            name: "Rise of Tycoon",
            start: "2010/06/29",
            end: "2030/01/01"
          }
        ];
      }

      // set the moment series data
      function momentData() {
        return [
          ["1971/06/28", "Elon Musk was born in South Africa"],
          ["1981/06/28", "Began to learn computer programming on his own"],
          ["1983/06/28", "Sold the code of his game Blastar for $500"],
          ["1990/09/01", "Entered Queen's University in Kingston, Ontario"],
          ["1992/09/01", "Transferred to the University of Pennsylvania"],
          ["1995/06/01", "Received bachelor's degrees in physics and economics"],
          ["1995/09/01", "Started a Ph.D. at Stanford (dropped out in 2 days"],
          ["1995/11/06", "Founded Zip2 with his brother"],
          ["1999/02/01", "Sold Zip2 to Compaq for $307M"],
          ["1999/03/01", "Co-founded X.com"],
          ["2000/03/01", "Merged X.com with Confinity to form PayPal"],
          ["2001/01/01", "Started conceptualizing Mars Oasis"],
          ["2002/03/14", "Founded SpaceX & became its CEO"],
          ["2002/10/03", "Received $175.8M from PayPal's sale to eBay for $1.5B"],
          ["2004/02/01", "Invested $6.5M in Tesla and joined its board as chairman"],
          ["2006/01/01", "SpaceX started to get NASA contracts"],
          ["2008/10/01", "Became CEO at Tesla"],
          ["2010/06/29", "Tesla's first IPO"],
          ["2015/12/11", "Co-founded OpenAI"],
          ["2016/07/01", "Co-founded Neuralink"],
          ["2018/02/21", "Resigned his board seat at OpenAI"],
          ["2021/11/06", "Started selling his Tesla stock (10% for $16.4B by year end)"],
          ["2022/04/13", "Made an offer to buy Twitter"],
          ["2022/07/08", "Withdrew his $44B bid to buy Twitter"]
        ];
      }

      anychart.onDocumentReady(function () {

        // create a timeline chart
        let chart = anychart.timeline();

        // create a range series
        let rangeSeries = chart.range(rangeData());

        // create a moment series
        let momentSeries = chart.moment(momentData());

        // configure the range series label settings
        rangeSeries.labels().format("{%name}");

        // set the chart title
        chart.title("Timeline of Elon Musk");

        // set the chart container id
        chart.container("container");

        // draw the chart
        chart.draw();

      });

    </script>
  </body>
</html>
Creating Custom JS Timeline Chart
The timeline looks engrossing as is. But there is always room for improvement! I will show you how some parts of such a JavaScript timeline chart can be nicely customized, again without much hassle.
1. Timeline chart colors
An easy and effective change when personalizing a chart is to modify colors.
First, I add the attributes fill and stroke to the range series data, and the timeline chart will automatically apply the corresponding values from there:
function rangeData() {
  return [
    {
      name: "Childhood and Education",
      start: "1971/06/28",
      end: "1995/09/01",
      fill: "#00a8e0 0.5",
      stroke: "#00a8e0"
    },
    {
      name: "Entrepreneur Journey",
      start: "1983/06/28",
      end: "2002/03/13",
      fill: "#1c4598 0.5",
      stroke: "#1c4598"
    },
    {
      name: "Making of Tycoon",
      start: "2002/03/14",
      end: "2010/06/28",
      fill: "#a05e9c 0.6",
      stroke: "#a05e9c"
    },
    {
      name: "Rise of Tycoon",
      start: "2010/06/29",
      end: "2030/01/01",
      fill: "#6e4c82 0.65",
      stroke: "#6e4c82"
    }
  ];
}
Second, I change the color of the moment series markers the following way:
momentSeries.normal().markers().fill("#ffdd0e");
momentSeries.normal().markers().stroke("#e9ae0b");
2. Range series labels and height
Next, I want to provide the content of the range series labels with the start and end years of the corresponding periods. It’s also easy to format the labels using HTML. Check it out.
rangeSeries
  .labels()
  .useHtml(true)
  .fontColor("#fff")
  .format(
    '{%name}<br><span style="font-size: 85%">{%start}{dateTimeFormat:YYYY}–{%end}{dateTimeFormat:YYYY}</span>'
  );
Let me also increase the height of the range series so the newly added information could neatly fit in. This is done in just one line of code.
rangeSeries.height(50);3. Timeline chart title
To give more information about what the timeline shows, I customize the chart title using HTML.
chart
  .title()
  .enabled(true)
  .useHtml(true)
  .text(
    '<span style = "color: #e12026; font-size:20px;">Timeline of Elon Musk</span>' +
    '<br/><span style="font-size: 16px;">Marking some of the most important professional milestones from 1971 to 2022</span>'
  );
Now the JS-based timeline chart has a subtitle, and the entire title section is beautified.
4. Timeline chart tooltip
After that, I want to make a few tweaks to the timeline chart tooltip, for both range and moment series.
For each series, I create an HTML-based format pattern for the tooltip text, enable HTML, and apply the configured format. For a crisp, finished look, I remove the tooltip titles and separators.
// format the range series tooltip
let rangeTooltipFormat =
  "<span style='font-weight:600;font-size:10pt'>" +
  "{%name}</span><br><br>From " +
  "{%start}{dateTimeFormat:YYYY} to " +
  "{%end}{dateTimeFormat:YYYY}";
rangeSeries.tooltip().useHtml(true);
rangeSeries.tooltip().format(rangeTooltipFormat);
rangeSeries.tooltip().title().enabled(false);
rangeSeries.tooltip().separator().enabled(false);

// format the moment series tooltip
let momentTooltipFormat =
  "<span>{%x}{dateTimeFormat: MMMM YYYY}</span>";
momentSeries.tooltip().useHtml(true);
momentSeries.tooltip().format(momentTooltipFormat);
momentSeries.tooltip().title().enabled(false);
momentSeries.tooltip().separator().enabled(false);
5. Timeline scroller
Exploring timeline charts is easier when you can easily take a closer look at a certain period. Here, you can use the mouse wheel to zoom in and out. But it’s also possible to add a scroller below the timeline, which requires only one quick line.
chart.scroller().enabled(true);6. Context menu and export
Finally, let me add one more cool thing, a context menu with options to save and share the timeline chart.
I just reference these JS and CSS files along with the others already present in the <head> section of the web page, and the default settings of the charting library will take care of the rest.
<script src="https://cdn.anychart.com/releases/8.11.0/js/anychart-ui.min.js"></script>
<script src="https://cdn.anychart.com/releases/8.11.0/js/anychart-exports.min.js"></script>
<link rel="stylesheet" href="https://cdn.anychart.com/releases/8.11.0/css/anychart-ui.min.css">
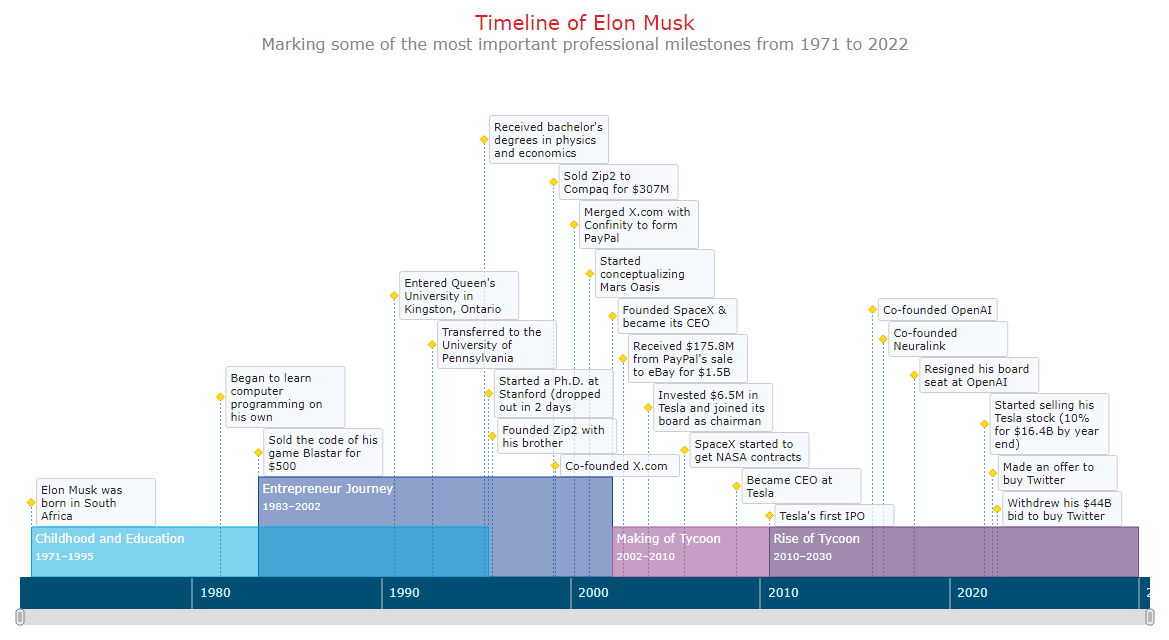
<link rel="stylesheet" type="text/css" href="https://cdn.anychart.com/releases/8.11.0/fonts/css/anychart-font.min.css"/>Result: Custom JS Timeline Chart
That’s all. An elegant interactive JavaScript timeline chart is ready!
Check out the code powering this timeline chart below. It is also available on AnyChart Playground where you can continue mastering JS timelines by further tweaking the visualization, adding your data, and so on.
<html>
  <head>
    <title>JavaScript Timeline Chart</title>
    <script src="https://cdn.anychart.com/releases/8.11.0/js/anychart-core.min.js"></script>
    <script src="https://cdn.anychart.com/releases/8.11.0/js/anychart-timeline.min.js"></script>
    <script src="https://cdn.anychart.com/releases/8.11.0/js/anychart-ui.min.js"></script>
    <script src="https://cdn.anychart.com/releases/8.11.0/js/anychart-exports.min.js"></script>
    <link rel="stylesheet" href="https://cdn.anychart.com/releases/8.11.0/css/anychart-ui.min.css">
    <link rel="stylesheet" type="text/css" href="https://cdn.anychart.com/releases/8.11.0/fonts/css/anychart-font.min.css"/>
    <style type="text/css">
      html, body, #container {
        width: 100%; height: 100%; margin: 0; padding: 0;
      }
    </style>
  </head>
  <body>
    <div id="container"></div>
    <script>

      // set the range series data
      function rangeData() {
        return [
          {
            name: "Childhood and Education",
            start: "1971/06/28",
            end: "1995/09/01",
            fill: "#00a8e0 0.5",
            stroke: "#00a8e0"
          },
          {
            name: "Entrepreneur Journey",
            start: "1983/06/28",
            end: "2002/03/13",
            fill: "#1c4598 0.5",
            stroke: "#1c4598"
          },
          {
            name: "Making of Tycoon",
            start: "2002/03/14",
            end: "2010/06/28",
            fill: "#a05e9c 0.6",
            stroke: "#a05e9c"
          },
          {
            name: "Rise of Tycoon",
            start: "2010/06/29",
            end: "2030/01/01",
            fill: "#6e4c82 0.65",
            stroke: "#6e4c82"
          }
        ];
      }

      // set the moment series data
      function momentData() {
        return [
          ["1971/06/28", "Elon Musk was born in South Africa"],
          ["1981/06/28", "Began to learn computer programming on his own"],
          ["1983/06/28", "Sold the code of his game Blastar for $500"],
          ["1990/09/01", "Entered Queen's University in Kingston, Ontario"],
          ["1992/09/01", "Transferred to the University of Pennsylvania"],
          ["1995/06/01", "Received bachelor's degrees in physics and economics"],
          ["1995/09/01", "Started a Ph.D. at Stanford (dropped out in 2 days"],
          ["1995/11/06", "Founded Zip2 with his brother"],
          ["1999/02/01", "Sold Zip2 to Compaq for $307M"],
          ["1999/03/01", "Co-founded X.com"],
          ["2000/03/01", "Merged X.com with Confinity to form PayPal"],
          ["2001/01/01", "Started conceptualizing Mars Oasis"],
          ["2002/03/14", "Founded SpaceX & became its CEO"],
          ["2002/10/03", "Received $175.8M from PayPal's sale to eBay for $1.5B"],
          ["2004/02/01", "Invested $6.5M in Tesla and joined its board as chairman"],
          ["2006/01/01", "SpaceX started to get NASA contracts"],
          ["2008/10/01", "Became CEO at Tesla"],
          ["2010/06/29", "Tesla's first IPO"],
          ["2015/12/11", "Co-founded OpenAI"],
          ["2016/07/01", "Co-founded Neuralink"],
          ["2018/02/21", "Resigned his board seat at OpenAI"],
          ["2021/11/06", "Started selling his Tesla stock (10% for $16.4B by year end)"],
          ["2022/04/13", "Made an offer to buy Twitter"],
          ["2022/07/08", "Withdrew his $44B bid to buy Twitter"]
        ];
      }

      anychart.onDocumentReady(function () {

        // create a timeline chart
        let chart = anychart.timeline();

        // create a range series
        let rangeSeries = chart.range(rangeData());

        // create a moment series
        let momentSeries = chart.moment(momentData());

        // configure the range series label settings
        rangeSeries
          .labels()
          .useHtml(true)
          .fontColor("#fff")
          .format(
            '{%name}<br><span style="font-size: 85%">{%start}{dateTimeFormat:YYYY}–{%end}{dateTimeFormat:YYYY}</span>'
          );

        // customize the moment series marker
        momentSeries.normal().markers().fill("#ffdd0e");
        momentSeries.normal().markers().stroke("#e9ae0b");

        // set the range series bar height
        rangeSeries.height(50);

        // format the range series tooltip
        let rangeTooltipFormat =
          "<span style='font-weight:600;font-size:10pt'>" +
          "{%name}</span><br><br>From " +
          "{%start}{dateTimeFormat:YYYY} to " +
          "{%end}{dateTimeFormat:YYYY}";
        rangeSeries.tooltip().useHtml(true);
        rangeSeries.tooltip().format(rangeTooltipFormat);
        rangeSeries.tooltip().title().enabled(false);
        rangeSeries.tooltip().separator().enabled(false);

        // format the moment series tooltip
        let momentTooltipFormat =
          "<span>{%x}{dateTimeFormat: MMMM YYYY}</span>";
        momentSeries.tooltip().useHtml(true);
        momentSeries.tooltip().format(momentTooltipFormat);
        momentSeries.tooltip().title().enabled(false);
        momentSeries.tooltip().separator().enabled(false);

        // set the chart title
        chart
          .title()
          .enabled(true)
          .useHtml(true)
          .text(
            '<span style = "color: #e12026; font-size:20px;">Timeline of Elon Musk</span><br/>' +
            '<span style="font-size: 16px;">Marking some of the most important professional milestones from 1971 to 2022</span>'
          );

        // enable the scroller
        chart.scroller().enabled(true);

        // set the chart container id
        chart.container("container");

        // draw the chart
        chart.draw();

      });

    </script>
  </body>
</html>
Conclusion
Creating and customizing beautiful interactive timeline charts is pretty simple when you know how to use JavaScript for that. I hope I have properly explained and illustrated that in this tutorial. To learn more, look into the timeline chart documentation, and don’t miss out on these cool timeline chart examples.
All in all, we don’t need to be an Elon Musk to build stunning visualizations. So let’s just go ahead and bring some data to life! Actually, there are numerous ways to visualize data and multiple chart types to choose from.
Feel free to ask questions here in the comments if anything needs to be clarified. Cheers.
We are thankful to Shachee Swadia for creating this fantastic timeline chart guide exclusively for our blog.
We’ve got more cool JavaScript charting tutorials on our blog that you may well want to check out.
Drop us a line if you’d like to write a guest post.
- Categories: AnyChart Charting Component, HTML5, JavaScript, JavaScript Chart Tutorials, Tips and Tricks
- No Comments »