Engaging Data Graphics on Hobbies, Protests, Commute, and Reddit — DataViz Weekly
April 23rd, 2021 by AnyChart Team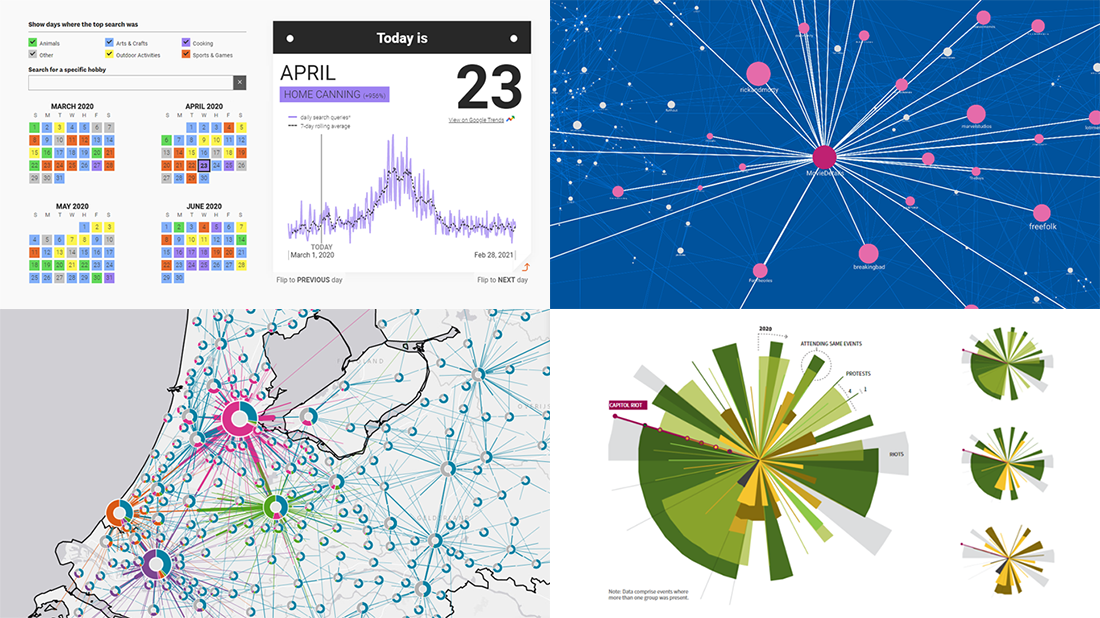 Can’t wait for a new portion of engaging data graphics? We’ve got it for you right here, right now! The following visualizations caught our eye this week, and DataViz Weekly is here to make sure you do not miss out on them:
- Top trending hobbies during the COVID-19 pandemic — Polygraph and Google Trends
- Right-wing protests in America in 2020-2021 — Reuters
- Commuting in the Netherlands — Statistics Netherlands
- Map of Reddit — Andrei Kashcha
- Categories: Data Visualization Weekly
- No Comments »