Happy New Year in JavaScript Charting: AnyChart 8.1.0 Is Out!
December 20th, 2017 by AnyChart Team The New Year and Christmas are already just around the corner, and we have something astonishing for you in this magical time! The next major update for our product family of JavaScript charting libraries is now released, so meet AnyChart 8.1.0!
Check out what new cool and useful features are delivered in the new versions of our HTML5-based interactive data visualization solutions AnyChart, AnyStock, AnyGantt and AnyMap, as well as what we are going to work on next.
- Categories: AnyChart Charting Component, AnyGantt, AnyMap, AnyStock, Financial Charts, Gantt Chart, HTML5, JavaScript, News, Qlik, Stock Charts
- 2 Comments »
Modular JavaScript Charting: AnyChart 8 Premiere
October 2nd, 2017 by AnyChart Team Fall is an amazing time for TV, movie, theater, and other art lovers as that’s when a lot of premieres are being launched. Well, we are happy to contribute to the debut mainstream this time! Meet AnyChart 8, a modular JavaScript charting system taking the convenience, performance, and customization in the art of interactive data visualization to the next level.
Join us in reviewing the core innovations delivered in the 8th, module-based generation of AnyChart, including the brand new features now available in our JS charting libraries AnyChart, AnyStock, AnyGantt, and AnyMap, as well as what else is in our nearest plans.
AnyChart JS Charts 8.0.0: Modules, Custom Builds, and Much More
The 8.0.0 release of the AnyChart, AnyGantt, AnyMap, and AnyStock JavaScript (HTML5) charting libraries delivers a lot of brand new features and technical improvements. Please see the list below for a quick overview of what’s new.
- Categories: AnyChart Charting Component, AnyGantt, AnyMap, AnyStock, Dashboards, Financial Charts, Gantt Chart, HTML5, JavaScript, News, Stock Charts
- 5 Comments »
AnyChart JavaScript Charting Libraries 7.14.0 Released: Can’t Stop Perfecting Data Visualization!
May 30th, 2017 by AnyChart Team![]() Here are the spring May flowers we promised. After the hard work put in over the past months, we’re happy to announce that the 7.14.0 release of our JavaScript charting libraries AnyChart, AnyStock, AnyMap, and AnyGantt is out and ready to download! It brings you new cool features and important improvements that will make your data visualization life even better.
Here are the spring May flowers we promised. After the hard work put in over the past months, we’re happy to announce that the 7.14.0 release of our JavaScript charting libraries AnyChart, AnyStock, AnyMap, and AnyGantt is out and ready to download! It brings you new cool features and important improvements that will make your data visualization life even better.
Now, we invite you to discover all the new JavaScript/HTML5 charting capabilities that the 7.14.0 version of AnyChart’s data visualization software product family has to offer to you. Here’s a quick overview…
- Categories: AnyChart Charting Component, AnyGantt, AnyMap, AnyStock, Business Intelligence, Dashboards, Financial Charts, Gantt Chart, HTML5, JavaScript, News, Stock Charts
- 7 Comments »
Choose Right Chart Type for Data Visualization. Part 3: Data Over Time (Trend Context)
April 26th, 2017 by AnyChart Team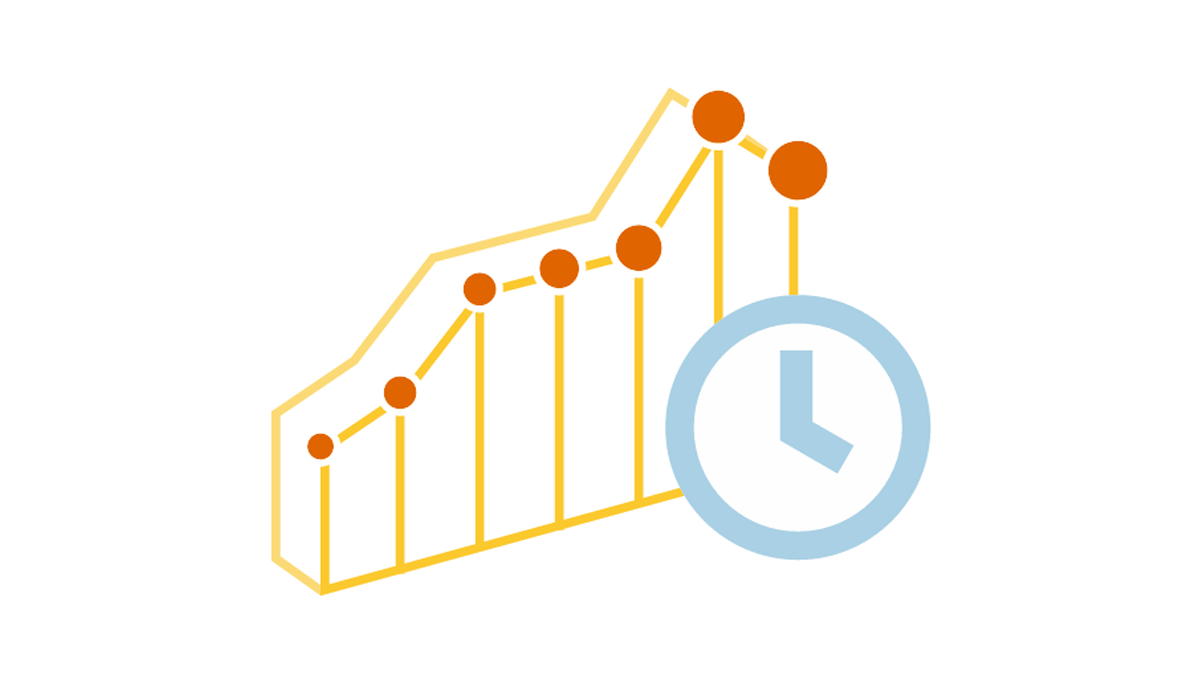 We are continuing the effort to better familiarize you with the world of chart types. This time let’s talk about good ways to visualize and explore Data Over Time.
Watching the change in data over time helps identify trends and dynamics in diverse timeline-based sets of values. Needless to say, choosing a right chart type is very important here. When applying an inappropriate form of visualization to your data, you might end up with an inaccurate idea of what happened in the past, what’s taking place now, and/or what will occur in the future. But we’ll do our best to help you avoid any mistakes in this field so you always make only right decisions based on your date/time data.
So, let’s get to the gist now.
- Categories: Choosing Chart Type, Tips and Tricks
- No Comments »
Data Visualization Weekly: JS Multi-Series Line Chart DataViz and More
February 10th, 2017 by AnyChart Team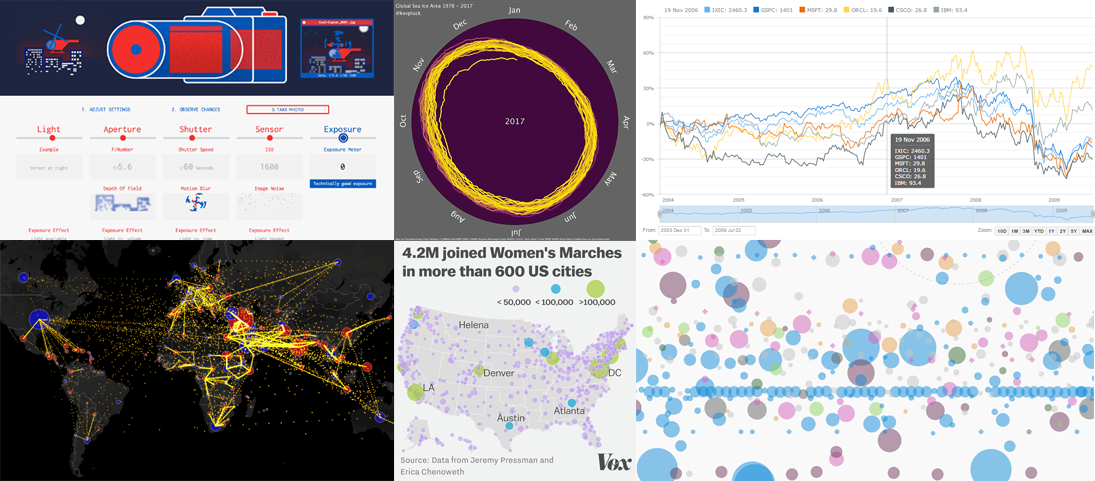 All dataviz lovers are welcome to the new issue of Data Visualization Weekly brought to you by AnyChart JS Charts! Today we are publishing the best and new chart, map and infographic examples shared on our Twitter and Facebook accounts during the last seven days.
So, get ready for the best peculiar practices that made the previous week in data visualization special! And now let’s take a look at what dataviz inspirations were most followed. Read more »
- Categories: Data Visualization Weekly, News
- No Comments »
AnyChart JS Charts 2016 Year in Review: Look How Much Was Done!
December 26th, 2016 by AnyChart TeamThis year has been so busy and fruitful for AnyChart JS Charts that now our team is extremely tired and feels incredibly happy at the same time. In fact, we went all out to make our JavaScript (HTML5) based charting libraries AnyChart, AnyStock, AnyGantt, and AnyMap even much more feature-rich, flexible, user-friendly, and faster with only one purpose – to bring you an unprecedented data visualization experience.
Looking back, we are proud of how MUCH was done in 2016! And now, we invite you to join us in quickly reviewing this year’s accomplishments that further strengthened AnyChart’s global leadership in interactive data visualization.
Without more ado, here is the list of new product and feature arrivals as well as major improvements to our JS charts solutions – a great chance to make sure you did not miss any important innovation.
![]()
1. More Types of JS Charts.
JS graphs and diagrams
- Treemap charts
- Linear gauges – LED, tank, and thermometer
- 3D area charts
- 3D bar charts
- 3D column charts
Stock and financial JS charts
- Candlestick charts
- Spline charts
- Step line charts
- Area charts
- Step area charts
- Spline area charts
- Marker charts
- Range column charts
- Range area charts
- Range spline area charts
JS Gantt charts
- PERT (Program Evaluation and Review Technique) charts
- Resource charts (redesigned; beta)
JS maps
- Dot (point) maps
- Flow (connector) maps
- Seat maps
2. More Features in JS Charts.
All JS charts
- Full accessibility (Section 508)
- Localization engine with 196 culture-specific locale settings files. Demos: AnyChart, AnyStock, AnyGantt, AnyMap
JS graphs and diagrams
- Chart themes/palettes (demo)
- Exclude/include data points
- Context menu
- Save data as XSLX and CSV
- Save chart configuration as XML and JSON
- String tokens
- Chart statistics
- Standalone chart elements
- Tooltip settings improvement
Stock and financial JS charts
- Drawing tools and annotations (demo)
- Technical indicators – MACD, RSI, SMA, EMA, ROC, Aroon, and custom
- Data grouping
- Markers on data points
- Range selection UI
- Legend interactivity
- Y-scale comparison mode (changes and percentage changes)
JS Gantt charts
- Calendar support
- Smart timeline
- Event markers for time intervals and important events
- Timeline markers for multiple milestones
JS maps
- Drill down
- Longitude/latitude API
- Move/zoom API
- Rich integration of keyboard and mouse controls
- 13 map projections
3. Easier JS charting.
- Chart editor (demo)
- Demos of business solutions including the following JavaScript (HTML5) dashboards:
- Web Audience dashboard
- Human Resources dashboard
- Investment Portfolio dashboard
- Sales dashboard
- CIO dashboard
- Site Speed Overview dashboard
- States of the US dashboard
- Migration tool – a small library for easier transit from AnyChart 5/6 to 7
- 20+ technical integration templates and samples for easy JS/HTML5 data visualization with any popular technology stack:
- ASP.NET – C# / C#, SignalR / VB.NET – MySQL integration template
- Clojure – ClojureScript – PostgreSQL integration template
- Go – (Revel) – MySQL integration template
- iOS – Objective-C – SQLite integration template
- Java Servlets – Maven, JDBC, JSP – MySQL integration template
- Java Spring – Maven, Hibernate – MySQL integration template
- Julia – MySQL integration template
- NodeJS – (Express, Jade) / Socket.IO – MongoDB integration template
- Perl – Catalyst – MySQL integration template
- PHP – (Laravel / Slim / Symfony) – MySQL integration template
- Python – Flask / Django – MySQL integration template
- R – Shiny – MySQL integration template
- Ruby on Rails – (Sinatra) – MySQL integration template
- Scala – Akka / Play – MySQL integration template
- Electron integration template
4. Faster JS Charts.
- Performance improvement (speed test):
- Less than 1s to render 250,000 data points
- Less than 60ms to stream 500 points
- Async rendering (docs)
5. New Products.
- AnyChart 7.x Plugins for Oracle APEX
- GraphicsJS, a powerful open-source JavaScript graphics library (SVG)
To sum up, 2016 was immensely intensive. But 2017 will be no less productive from the very beginning – we promise.
We wish you a peaceful, prosperous, and happy new year!
- Categories: AnyChart Charting Component, AnyGantt, AnyMap, AnyStock, Business Intelligence, Dashboards, Financial Charts, Gantt Chart, GraphicsJS, HTML5, JavaScript, News, Oracle Apex, Stock Charts
- 2 Comments »
AnyChart Stock and Financial Charts Now Available
December 14th, 2010 by Margaret SkomorokhWe are happy to announce the availability of AnyStock, a cross-platform tool for implementing stock and financial charts in custom web and desktop applications. Perhaps, creating of AnyChart Stock has taken more time than anticipated, but we are proud of its quality and of the results achieved.
The component includes a wide variety of technical indicators and financial chart types, all of them being combinable. The ability to review long term and large data sets can be handled with scroll, pan, and zoom controls. Adding news events – analyst opinions, insider trading, dividends, and key developments – helps to analyze information.
It should be especially noted that the Resources section contains countless application samples and adjustments for JSON as well as XML, so developing and tuning charts in your application will be really easy.
Some of the key features are:
Show Significant Events Using Special Markers
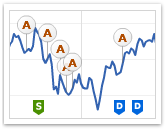 |
One of the most important features of AnyStock are Event Markers – a special type of chart markers that are created to provide best experience in showing Key Developments, Dividends, Splits, Insider Transactions, Analyst Opinion Changes or any other events on Financial charts. Event markers can be bound to a chart series or to the timeline. |
Real-Time Data Streaming and Data Manipulations
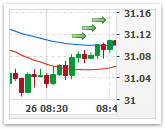 |
A full feature set for creating real-time streaming and data manipulation applications is available. The JavaScript library coming with the component has methods that allow adding, updating, removing or inserting new data points or range of points. All the operations run fast and smart and allow setting new data without reloading the chart. |
Fully Configurable Localization
 |
The component allows localizing the appearance of date, time and numbers to suit the region’s language and cultural peculiarities. To make the localization even easier, a special utility was created that allows obtaining the required regional configuration in a matter of minutes. |
Advanced Interactivity
 |
AnyChart Stock is fully interactive. All of its navigation elements meet all the industry’s usability standards and are very comfortable in use. |
Attractive and Flexible Visual Settings
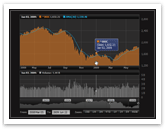 |
All the visual elements are configured to provide the best user experience: mild and clear colors, intuitive controls, and so on. Almost every part of a chart can be quickly customized. |
We hope that you will appreciate the component. If you have any additional questions, our Support and Sales teams are ready to help you.
Please download the trial version: https://www.anychart.com/download/
And visit the product page: http://6.anychart.com/products/anystock7/overview/
- Categories: AnyStock
- No Comments »