How to Create Financial Open-High-Low-Close (OHLC) Chart Using JavaScript
September 7th, 2021 by Shachee Swadia A stepwise guide on how to create interactive financial charts in the form of an OHLC chart. Visualizing the stock prices of Amazon over the course of Jeff Bezos’s tenure as the CEO.
Financial charts are especially useful to represent large amounts of data and identify trends. Would like to learn one such cool financial chart called the OHLC chart that visualizes stock price movement?
Read the JS charting tutorial »
- Categories: AnyChart Charting Component, AnyStock, Big Data, Financial Charts, HTML5, JavaScript, JavaScript Chart Tutorials, Stock Charts, Tips and Tricks
- No Comments »
New Awesome Charts and Maps Curated for Data Visualization Fans — DataViz Weekly
September 3rd, 2021 by AnyChart Team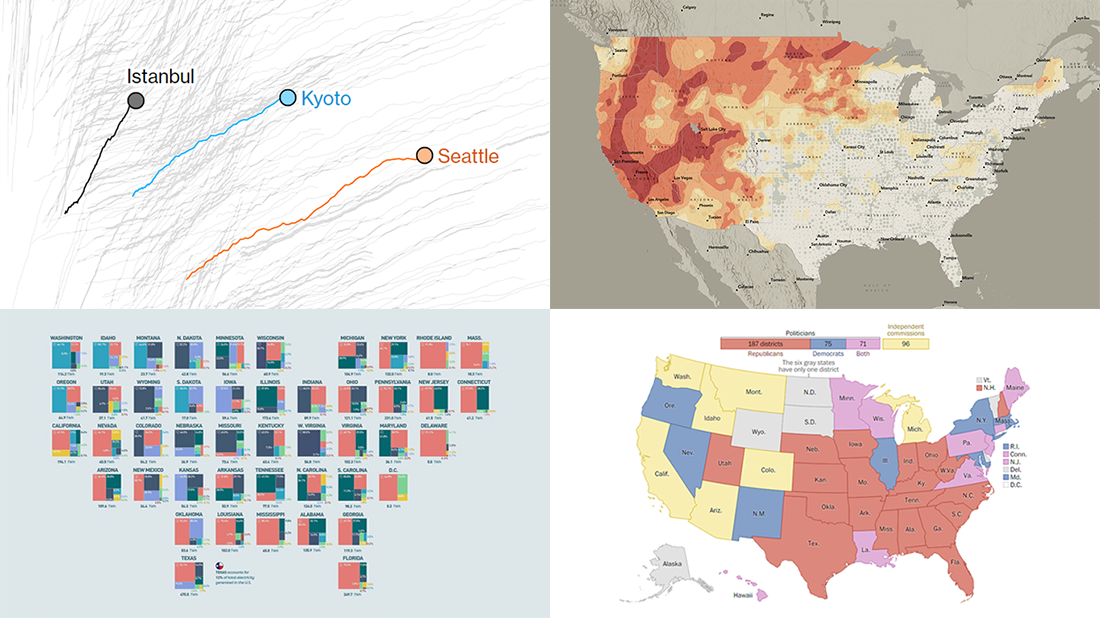 The seven-day wait is over for all data visualization fans wherever you are! DataViz Weekly is back with a selection of new awesome charts and maps curated from around the web. Look at our latest picks.
- Current and historic drought conditions across the United States — Esri
- Relationship between temperature, income, and mortality — Bloomberg Green
- U.S. electricity mix by state — Visual Capitalist
- Congressional redistricting rules and practices — The Washington Post
- Categories: Data Visualization Weekly
- 1 Comment »