Visualizing Organization Structure, Location Guesses, Time Allocation, and Retreats from Streets — DataViz Weekly
January 17th, 2020 by AnyChart Team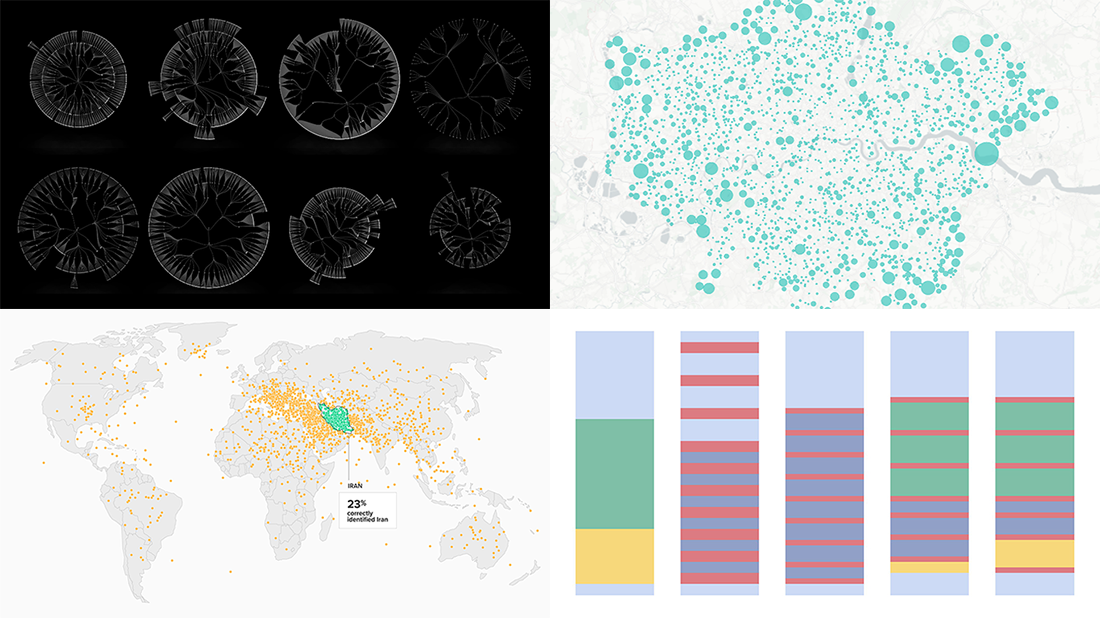 Join us on a quick review of some of the most interesting projects with cool charts and maps made public just recently. These are good examples of visualizing organization structure, changes in time spending patterns, and more. Here’s a full list of the projects highlighted in today’s DataViz Weekly:
- Structure of British government departments — Peter Cook
- Identifying Iran on unlabeled maps — Morning Consult
- Time allocation before and with a baby — Caitlin Hudon
- Retreats from busy streets in big cities — Hans Hack
- Categories: Data Visualization Weekly
- No Comments »
Data Analysis Through Visualization in New Examples: Citywide Migration, Cost of Living, #JobsNotMobs, Urban Evolution — DataViz Weekly
November 16th, 2018 by AnyChart Team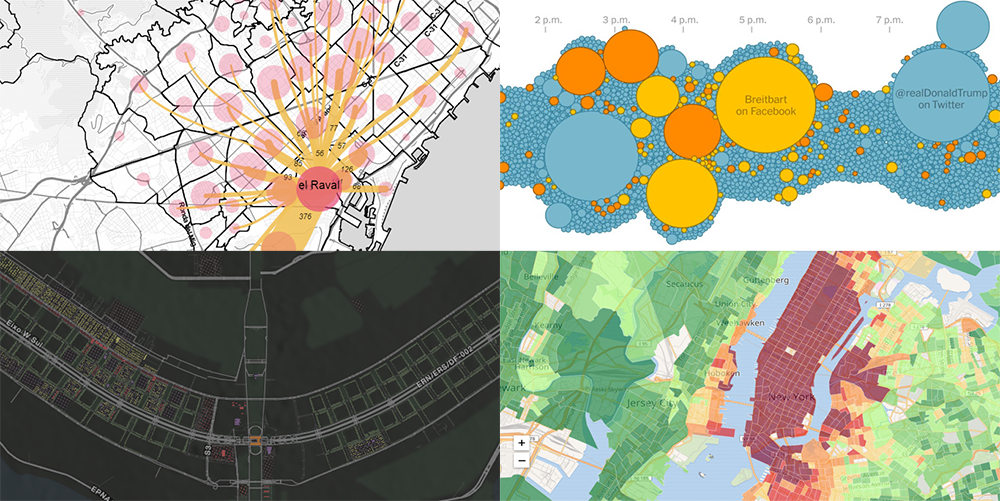 With visualization, data analysis can get easier, faster, and more insightful. In this DataViz Weekly article, we’ll share a few more interesting practical examples we’ve recently come across:
- internal migration paths in Barcelona;
- cost of living in the United States;
- #JobsNotMobs meme transition onto a slogan;
- urban evolution of Brasilia.
- Categories: Data Visualization Weekly
- No Comments »
Choose Right Chart Type for Data Visualization. Part 7: Geovisualization with Maps (Geo-Related Data)
May 24th, 2017 by AnyChart Team Geovisualization and map-based analysis of geo-data sets related to given territories or spatial environments can provide significant insight into trends and assist greatly in exploring and associating the impacts of variables. Nowadays, maps are used for data visualization very frequently, both as standalone geovisualizations and part of complex dashboards.
In this new article within the framework of our Choose Right Chart Type for Data Visualization series, we’ll write about map charts and explain how (when) to properly use each of corresponding types.
- Categories: Choosing Chart Type, Tips and Tricks
- No Comments »