Integrating AnyChart JS Charts in Python Django Financial Trading Dashboard
December 3rd, 2024 by Michael Whittle We are pleased to share an insightful article by Michael Whittle, a seasoned solution architect and developer with over 20 years of experience. Originally published on EODHD.com, it explores how he integrated our JavaScript charting library into a financial trading dashboard built with Python Django. Michael also shares his experience migrating a treemap from D3.js to AnyChart and explains why he chose our solution for implementing a stock chart, highlighting the intuitive code and enhanced functionality. Read on to discover how you can elevate your financial data visualizations in Python Django web applications with AnyChart JS Charts.
- Categories: AnyChart Charting Component, AnyStock, Big Data, Dashboards, Financial Charts, HTML5, JavaScript, Stock Charts, Third-Party Developers, Tips and Tricks
- No Comments »
Mais Hatem Visualizes Reddit Data Using AnyChart JS Charting Library
November 25th, 2020 by AnyChart Team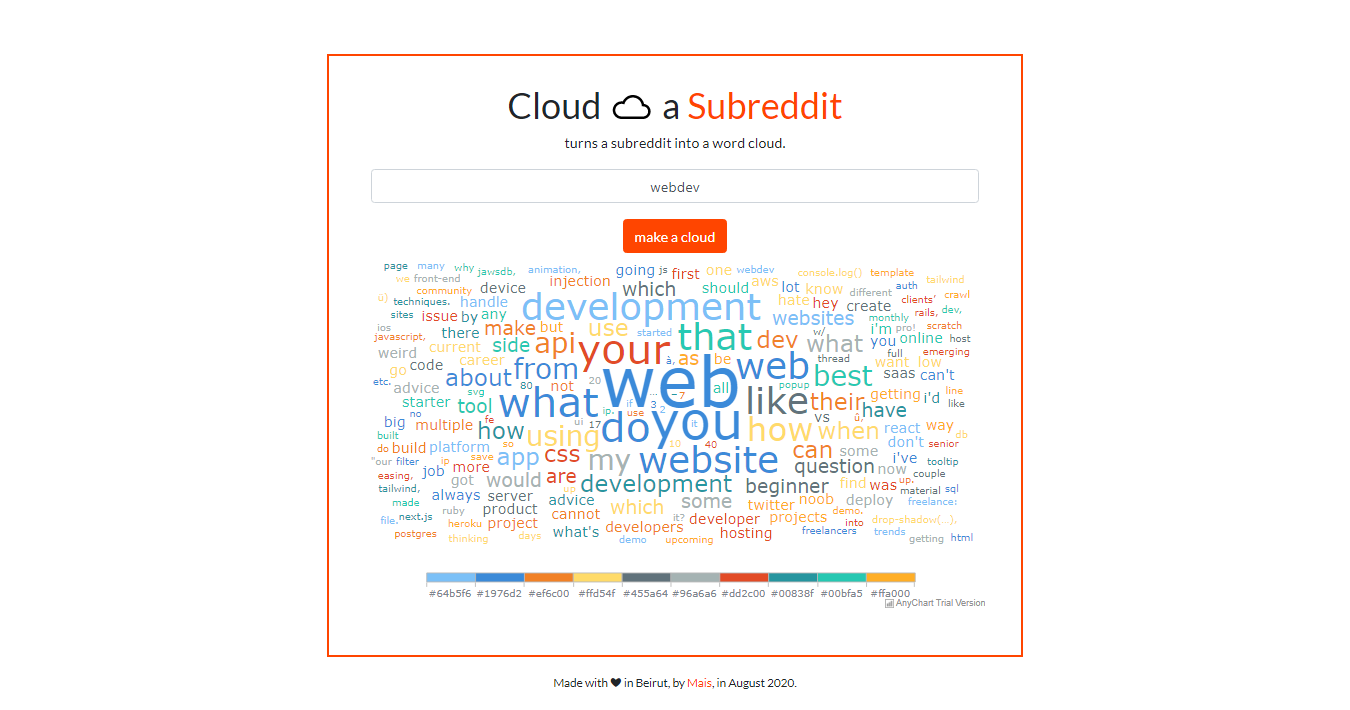 Leading the data visualization market with the best-in-class solutions, we are always excited to see how not only companies but also individuals from all over the world use them to produce interactive charts in their projects. Here’s one new interesting example we’ve recently learned about. Mais Hatem from Syria, currently an undergraduate at the American University of Beirut (Lebanon), created “Cloud a Subreddit,” a web project that generates a beautiful interactive Word Cloud chart out of any given Reddit’s subreddit with the help of the AnyChart JS library.
We had a quick interview with Mais where she told us more about her work and experience using AnyChart. Check it out.
- Categories: AnyChart Charting Component, Big Data, HTML5, JavaScript, Success Stories
- No Comments »