 Leading the data visualization market with the best-in-class solutions, we are always excited to see how not only companies but also individuals from all over the world use them to produce interactive charts in their projects. Here’s one new interesting example we’ve recently learned about. A developer created “Cloud a Subreddit,” a web project that generates a beautiful interactive Word Cloud chart out of any given Reddit’s subreddit with the help of the AnyChart JS library.
[Editor’s note: The interviewee’s personal details have been removed following a GDPR request.]
We had a quick interview with the creator to learn more about the work and experience of using AnyChart. Check it out.
AnyChart: What role does data visualization play in your life?
Developer: It’s mainly a hobby. I like experimenting with JavaScript and RESTful APIs in general. I’m genuinely excited by the act of turning words and numbers into colored charts that are visually appealing.
Generally speaking, there are tons of open APIs out there with plenty of information that’s sitting in a boring JSON or XML format. So, I imagine it would be great if more significant data can be visualized in domains like health or public governance. It’s also definitely easier to talk to people when you have charts to back you up.
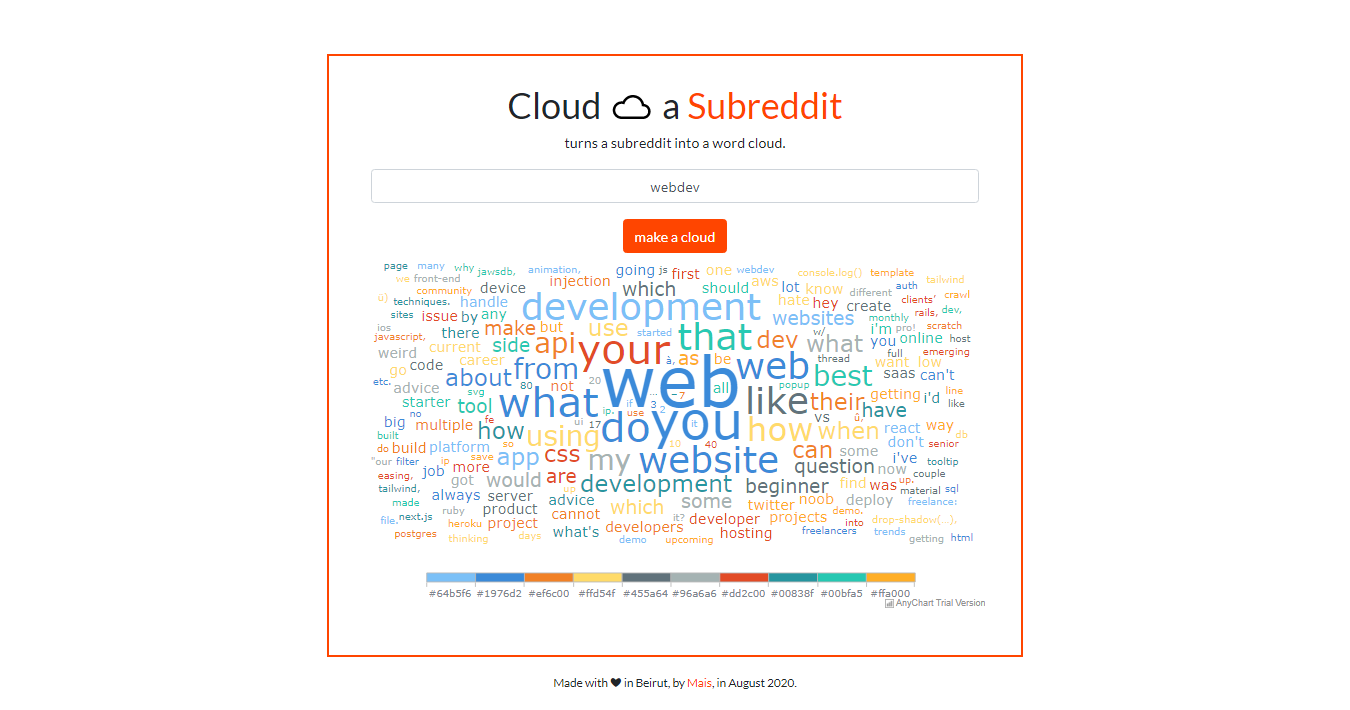
A: How did the idea of “Cloud a Subreddit” first come? Why did you decide to develop it?
D: I was attempting doing the #7days7websites challenge, and I came across a developer who analyzed movie scripts into gender charts. I spent quite some time reading their documentation and making sense of their code. As a daily user of Reddit, I thought it would be cool to scrape the first couple of pages of each subreddit and make a word cloud out of them.
In addition to being fun, word clouds are a very quick way to give readers a clear insight about what’s going on in texts. In this case, such a colorful bubble of words could provide a snapshot of what is currently most important to the subscribers and visitors of a certain subreddit.
A: So what is “Cloud a Subreddit” now and is it exactly what you wanted to build?
D: For the user, it’s just as simple as that. You enter a subreddit’s name, without “/r/” or spaces, press the orange button, and there you go: A beautiful interactive word cloud is generated on the same page within a moment, and it allows you to see at a glance what words are the most frequently used in that subreddit’s first-page post titles right now.
That’s exactly the basic functionality I was going to provide.
Of course, there are always more keywords to filter. This project is open source and I remember labeling this as an issue on GitHub, which led the repository to receive useful contributions from HacktoberFest participants. This made me very happy as it was my first repository to have complete strangers work on with me.
A: Looks cool indeed! Do you think of adding or updating something in your tag cloud tool moving forward?
D: For future improvements, there are many places to start from, including the front-end layout. However, it is mainly tempting to go with NLP processing to automatically tokenize words, instead of filling dictionaries. Another cool thing would be for each word cloud to also show the “general sentiment” of the given subreddit.
So, a lot can be done and I’d like to do much more. Basically, I hope this project serves as a good starter for my knowledge and skills in text mining and that I possess enough time for everything.
A: Please tell us more about the technical side. How do you work with Reddit data? What technology stack does your project use and was the integration of AnyChart into it easy enough?
D: The fact that I could add .json to any Reddit link made everything easy. To issue GET requests, I used JavaScript’s Fetch API. I then populated a dictionary of word occurrences, after passing them through a filter for unimportant words such as linking words and definitive and indefinite articles. Then comes the fun part of passing my dictionary to my anychart object, in order to make a word cloud. I used Bootstrap to maintain responsiveness.
Integrating AnyChart into my project was indeed seamless as I only included two lines of CDN imports.
A: Why did you choose the AnyChart JS charting library at all? What did you like most about it?
D: I looked into different libraries and frameworks, but AnyChart was the easiest to start and familiarize with due to its great documentation.
A: When someone asks you for advice on which JavaScript library to use for data visualization, how would you recommend AnyChart in a nutshell?
D: Easy to personalize graphs, and great documentation.
A: Thank you!
Check out more customer story interviews and selected case studies.
If you’d like to share your AnyChart story, please get in touch.
- Categories: AnyChart Charting Component, Big Data, HTML5, JavaScript, Success Stories
- No Comments »