Data Charting on Health Care, Elections, Income, and Countries — DataViz Weekly
April 19th, 2019 by AnyChart Team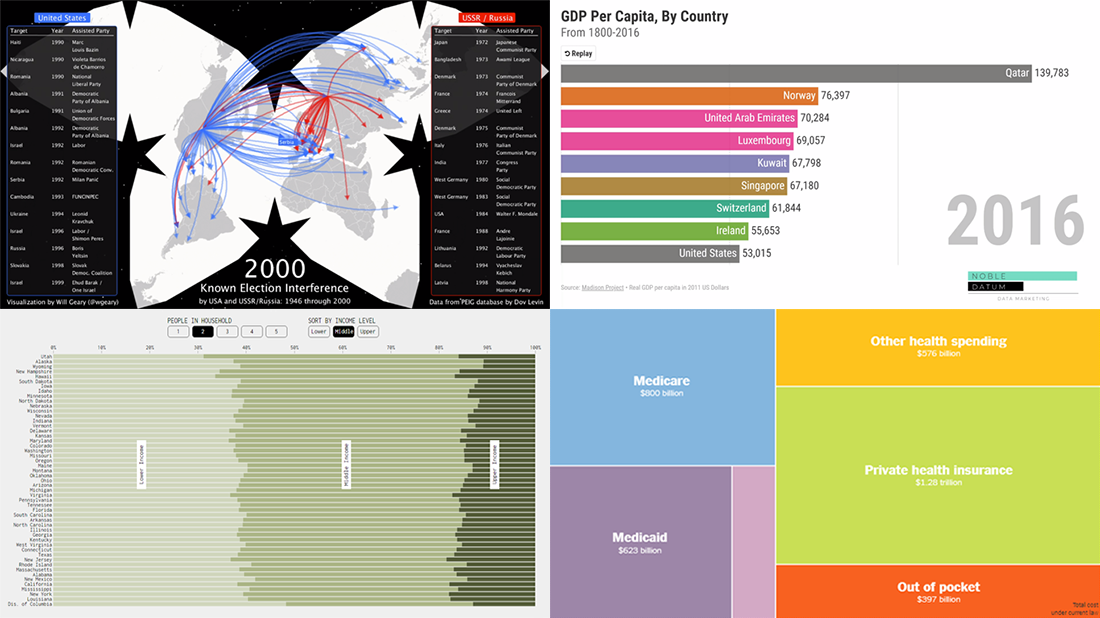 Various data charting examples get published on the web every day. They are part of visual stories, analytical reports, scientific studies, and so on. Every week, we choose four of the most interesting projects with charts and maps we’ve come across and feature them in a special post on the AnyChart blog within the framework of our regular DataViz Weekly series. So here’s a new one!
Today on Data Visualization Weekly:
- estimates of health care expenditures under the “Medicare for All” plan by U.S. Senator Bernie Sanders;
- electoral interference instances by the United States and USSR (Russia) in 1946-2000;
- U.S. households in each state by income level;
- top countries by GDP per capita in 1801-2016.
- Categories: Data Visualization Weekly
- No Comments »