Graphics Visualizations About Immigration, Elections, Pitchers, and Salinity — DataViz Weekly
May 17th, 2019 by AnyChart Team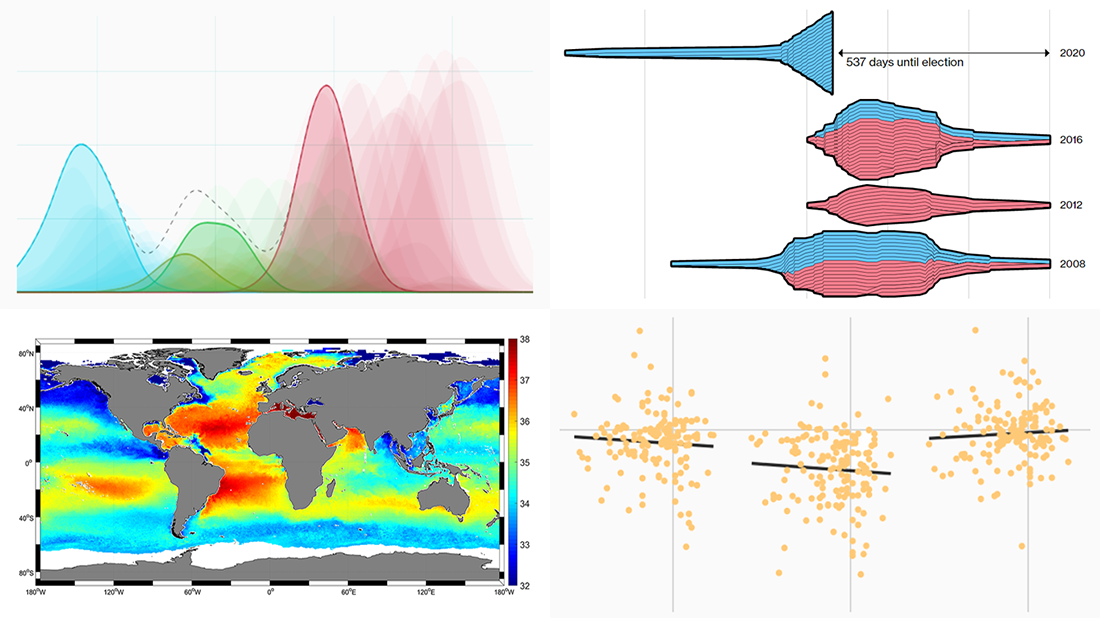 New DataViz Weekly is here, highlighting some of the new cool graphics visualizations we found around the web just recently:
- Finding a link between undocumented immigration and crime in the United States
- Competition in the U.S. presidential elections since 1980
- MLB pitchers’ pitch distribution
- Sea-surface salinity
- Categories: Data Visualization Weekly
- No Comments »