January 27th, 2011 by Timothy Loginov
Today we introduce a beta version of AnyStock for Silverlight. AnyChart Stock and Financial Charts is an XML/JSON Flash based financial charting solution, which we have recently launched. And now it is also our first component for Microsoft Silverlight – an application framework similar to Adobe Flash, designed for writing and running rich Internet applications. We invite everybody to participate in our beta testing program and receive a discount upon release. Please check out the demo portals:
And see the beta testing page: https://www.anychart.com/beta/silverlight/
December 25th, 2010 by Margaret Skomorokh
Best wishes for the holidays and for health and happiness throughout the coming year. We hope this year you found our products convenient and comfortable and assure that you will like them even more the next one – before the New Year’s Eve we will yet gladden you by news and announcements.Among AnyChart’s clients there are market leaders and startups without websites, our OEM or SAAS partners and enterprise solution developers; some are now taking ocean-facing baths and some are being filled up with snow. They have different views and ideals, but all of us are united by the love for beauty and aesthetics even in such a serious field as business, financial and statistical graphics. Happy Charting Everybody!

P.S.: Cheshire kitten by one of our favorite artists Vlad Gerasimov: http://www.vladstudio.com
December 14th, 2010 by Margaret Skomorokh
We are happy to announce the availability of AnyStock, a cross-platform tool for implementing stock and financial charts in custom web and desktop applications. Perhaps, creating of AnyChart Stock has taken more time than anticipated, but we are proud of its quality and of the results achieved.
The component includes a wide variety of technical indicators and financial chart types, all of them being combinable. The ability to review long term and large data sets can be handled with scroll, pan, and zoom controls. Adding news events – analyst opinions, insider trading, dividends, and key developments – helps to analyze information.
It should be especially noted that the Resources section contains countless application samples and adjustments for JSON as well as XML, so developing and tuning charts in your application will be really easy.
Some of the key features are:
Show Significant Events Using Special Markers
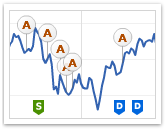 |
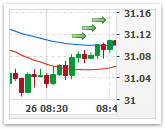
One of the most important features of AnyStock are Event Markers – a special type of chart markers that are created to provide best experience in showing Key Developments, Dividends, Splits, Insider Transactions, Analyst Opinion Changes or any other events on Financial charts. Event markers can be bound to a chart series or to the timeline. |
Real-Time Data Streaming and Data Manipulations
 |
A full feature set for creating real-time streaming and data manipulation applications is available. The JavaScript library coming with the component has methods that allow adding, updating, removing or inserting new data points or range of points. All the operations run fast and smart and allow setting new data without reloading the chart. |
Fully Configurable Localization
 |
The component allows localizing the appearance of date, time and numbers to suit the region’s language and cultural peculiarities. To make the localization even easier, a special utility was created that allows obtaining the required regional configuration in a matter of minutes. |
Advanced Interactivity
 |
AnyChart Stock is fully interactive. All of its navigation elements meet all the industry’s usability standards and are very comfortable in use. |
Attractive and Flexible Visual Settings
 |
All the visual elements are configured to provide the best user experience: mild and clear colors, intuitive controls, and so on. Almost every part of a chart can be quickly customized. |
We hope that you will appreciate the component. If you have any additional questions, our Support and Sales teams are ready to help you.
Please download the trial version: https://www.anychart.com/download/
And visit the product page: http://6.anychart.com/products/anystock7/overview/
June 25th, 2010 by Margaret Skomorokh
Robin Wauters from TechCrunch writes:
Last March, Adobe and Google jointly announced that Flash Player would soon come built in to the latter’s Chrome browser, eliminating the need for users to download, install and update it separately.
On Thursday evening, Google released Chrome 5.0.375.86 to the Stable channel on Linux, Mac, and Windows, with a fix for a number of security issues. More importantly, the integrated Flash Player has now been enabled by default.
As Stephen Shankland over at CNET points out, built-in Flash was previously only available in the developer and beta releases of the speedy WebKit-based browser, and the release to the Stable channel means the integrated plug-in is now available in its mainstream version.
The update comes a mere two days after Google re-enabled the integrated Flash Player plug-in by default in the Beta channel after disabling it for some time.
Not only is Google giving Adobe’s Flash technology another vote of confidence (Flash Player 10.1 for Mobile, which was announced earlier this week, will be rolled out on Android 2.2 phones first), but the integration also means any updates to Flash Player will be delivered directly via Google Chrome’s updating system, ultimately minimizing security risks that tend to surface when one uses outdated software and components.
June 24th, 2010 by Margaret Skomorokh
New version of Oracle APEX is available. A lot of new features >>
And… Improved Charting with Gantts and Maps
“The underlying charting engine has been upgraded to AnyChart 5.1 which is faster, provides better graphics, and decreases rendering time. Developers can take advantage of the many additional attributes to readily customize the appearance of their charts. Declarative support for project and resource Gantt charts together with flash Maps has also been incorporated.”
To view the new features in action, run the demonstration application.
July 27th, 2009 by Margaret Skomorokh
We were getting strange bug reports during several years, and the main idea of that reports is the fact that memory in Internet Explorer 6/7 with Flash Player 9/10 leaks when user refreshes the page. We have spent a lot of time and money trying to locate it, we lost a lot of clients. It was a nightmare for everybody in our support and development teams. We have blamed Adobe and Microsoft, but we never could even think that it is not their fault. And today the miracle has happened. We have tested on two different PCs: one of of them had the memory leak, the second one did not. And the reason of the problem was… Internet Explorer Skype add-on.
Read more »
July 23rd, 2009 by Anton Baranchuk
SEATTLE, Washington, July 22 — AnyChart has introduced the new version of its comprehensive charting solution AnyGantt, enabling creation of interactive and informative Gantt charts supporting animation. The new version delivers a host of enhancements to cut costs and maximize visualization, including the ability to edit Gantt Charts on a client-side computer.
AnyGantt now allows a user to edit tasks, change the duration, and add progress updates. Along with a GUI-based interface, the software provides advanced Java Scripting data manipulation capabilities. The users can employ this new extended functionality to build complex web based project management systems, without wasting money on expensive BI tools. Read more »
June 30th, 2009 by Timothy Loginov
To provide AnyChart Users with even more information about our software products AnyChart launches the Knowledge Base. We will do our best to put there most relevant troubleshooting information, articles, white papers, user manuals, or answers to frequently asked questions. Please use the following URL to access the knowledge base: https://www.anychart.com/kb/ Feel free to suggest your questions to add to our KB and thank you for using our products!
June 14th, 2009 by Timothy Loginov
|
On 14th of June AnyChart is proud to release version 4.1.0 of AnyGantt Flash Gantt Component with UI and JavaScript Chart Editing Features.
Now you can create full-featured interactive applications for project management applications.
Please download the latest trial version from AnyChart Download Section.
|
|
New Features
- Editing tasks, resources or periods properties using client-side User Interface.
- Editing tasks, resources or periods properties using JavaScript.
- Ability to select tasks, resources or periods.
- Editing, selection event model.
- Summary Tasks Auto-Recalculation.
- Retrieving chart details in XML format.
- Retrieving chart details in JavaScript format.
- Milestones in Resource Projects.
- Resources Grouping Feature.
To give an idea how AnyGantt can be used and demonstrate key features we have created these online-demos:
June 9th, 2009 by Anton Baranchuk
For Immediate Release
Rich Data Visualization is Now Available for Microsoft SharePoint Users
Seattle, WA June 10, 2009 – The AnyChart Company, a leading provider of data visualization solutions, has announced an OEM agreement with CorasWorks for its AnyChart for SharePoint Product. Under the terms of this agreement the existing users of CorasWorks Data Integration Toolset will soon be able to take the full advantage of the rich data visualization functionality developed by AnyChart at no extra cost.
Read more »