Qlik Connect 2025 Recap: Incredible Ride for Excel-lence
June 19th, 2025 by AnyChart Team Qlik Connect 2025 is now in the books, and it was everything we hoped for — and more. Building on last year’s success, we returned to Orlando to find even more connections, deeper engagement, and a truly electric atmosphere around our booth. Our brand-new Excel-style Spreadsheets for Qlik Sense turned heads, and our chance-to-win activities became a real magnet on the show floor.
The buzz was real — just take a look below, then read on for a recap of our time at Qlik Connect:
Read more at qlik.anychart.com »
- Categories: AnyChart Charting Component, Big Data, Business Intelligence, Dashboards, News, Qlik
- No Comments »
Heading to Qlik Connect 2025 — Join Us There!
February 25th, 2025 by AnyChart Team We are going to Qlik Connect 2025! 🚀
Not packing just yet — May is still a bit away. But we are getting ready and looking forward to meeting the amazing Qlik community in Orlando, with lots of great presentations and conversations ahead.
We will be there with our Qlik Sense extensions, bringing something special to push the boundaries of visual analytics in Qlik even further. Make sure to stop by if you are around — we would love to connect!
And while we are counting down the days, feel free to check out how great it was last year — take a moment to revisit our Qlik Connect 2024 recap.
See you in Florida! 📍
- Categories: Big Data, Business Intelligence, Dashboards, News, Qlik
- No Comments »
Celebrating Success at Qlik Connect: Recap from AnyChart
July 10th, 2024 by AnyChart Team Qlik Connect 2024 was nothing short of amazing, not just for its vibrant atmosphere but also for the palpable successes we experienced. Beyond the buzz, we showcased our latest advancements for Qlik Sense, gathered a wealth of insights, made meaningful contacts, and ran a hit interactive game that became the talk of the event. We even clinched a win in the social media contest — an unplanned but welcome accolade indeed! Join us for a recap of our time at Qlik Connect in Orlando.
Read more at qlik.anychart.com »
- Categories: Big Data, Business Intelligence, Dashboards, News, Qlik, Success Stories
- No Comments »
Let’s Connect at Qlik Connect 2024: AnyChart Booth #807
May 13th, 2024 by AnyChart Team Qlik Connect 2024 is on the horizon, and we’re pleased to announce that AnyChart will be participating as an Emerald sponsor and exhibitor. Join us from June 3–5 at Rosen Shingle Creek in Orlando, Booth #807!
Read more at qlik.anychart.com »
- Categories: AnyChart Charting Component, Business Intelligence, Dashboards, Gantt Chart, News, Qlik
- No Comments »
Join AnyChart at QlikWorld Tour 2023
August 10th, 2023 by AnyChart Team Get ready to dive into an exceptional data experience at QlikWorld Tour 2023! We at AnyChart are super stoked to be part of this epic roadshow as proud sponsors and warmly invite you to join us in one of the participating U.S. cities:
- Dallas (The Star in Frisco) — August 10
- San Francisco (Oracle Park) — August 24
- New York (Pier60 at Chelsea Pier) — September 18
- Atlanta (College Football Hall of Fame) — September 20
Spoiler alert: The star of the show will be our first-ever presentation of YODA — Your Own Documents Assistant, the newest, groundbreaking, AI-driven extension for Qlik Sense. Be among the first to witness its power!
Read more at qlik.anychart.com »
- Categories: AnyChart Charting Component, AnyGantt, Big Data, Business Intelligence, Dashboards, Gantt Chart, News, Qlik
- No Comments »
Qlik Gantt & Sunburst’s Exciting New Features + Upgrades Across All Extensions!
April 18th, 2023 by AnyChart Team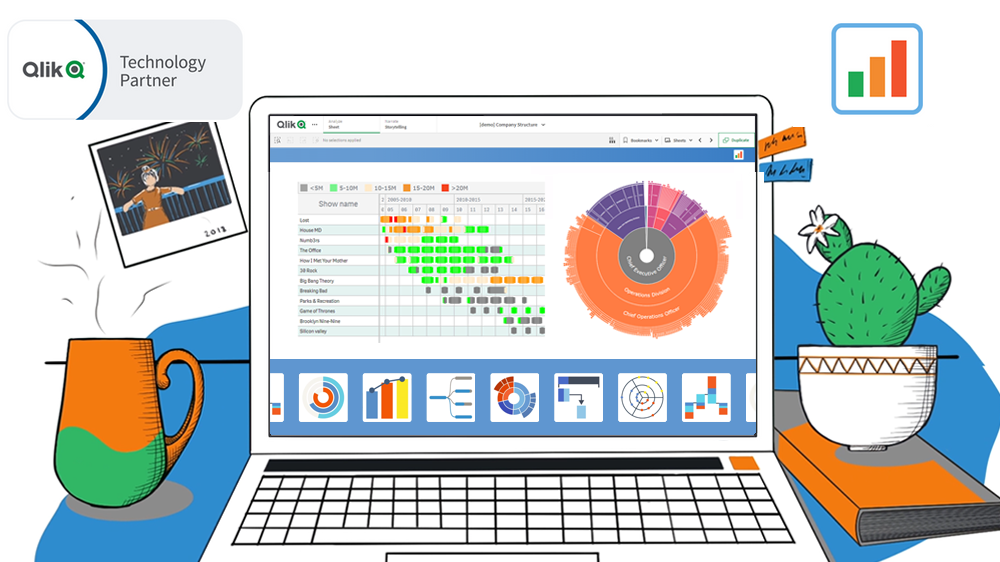 Hey Qlikkies! We have some exciting news to share with you today. AnyChart’s Qlik Sense Extensions have undergone a major update as we’ve made improvements across all of them, including the Decomposition Tree. However, we are particularly thrilled to announce the addition of some major features to our Sunburst Chart and Gantt Chart extensions.
But wait, there’s more! If you’re attending QlikWorld these days, we invite you to visit our team in Booth #180. There, you can try out the new features in action, ask questions, and learn more about how our extensions can improve your visual analytics experience in Qlik Sense. Don’t miss out on this chance to experience the AnyChart difference first-hand!
Our team has been hard at work, listening to your feedback and making improvements. We are confident that these new features will give you greater creative control and better performance in your Qlik-powered environment. So without further ado, let’s dive into the details of the major new upgrades!
Read more at qlik.anychart.com »
- Categories: AnyChart Charting Component, AnyGantt, Big Data, Business Intelligence, Dashboards, Gantt Chart, News, Qlik
- No Comments »
Qlik Sense Timeline Chart and More New Features in AnyGantt Extension V 4.1.244
April 24th, 2020 by AnyChart Team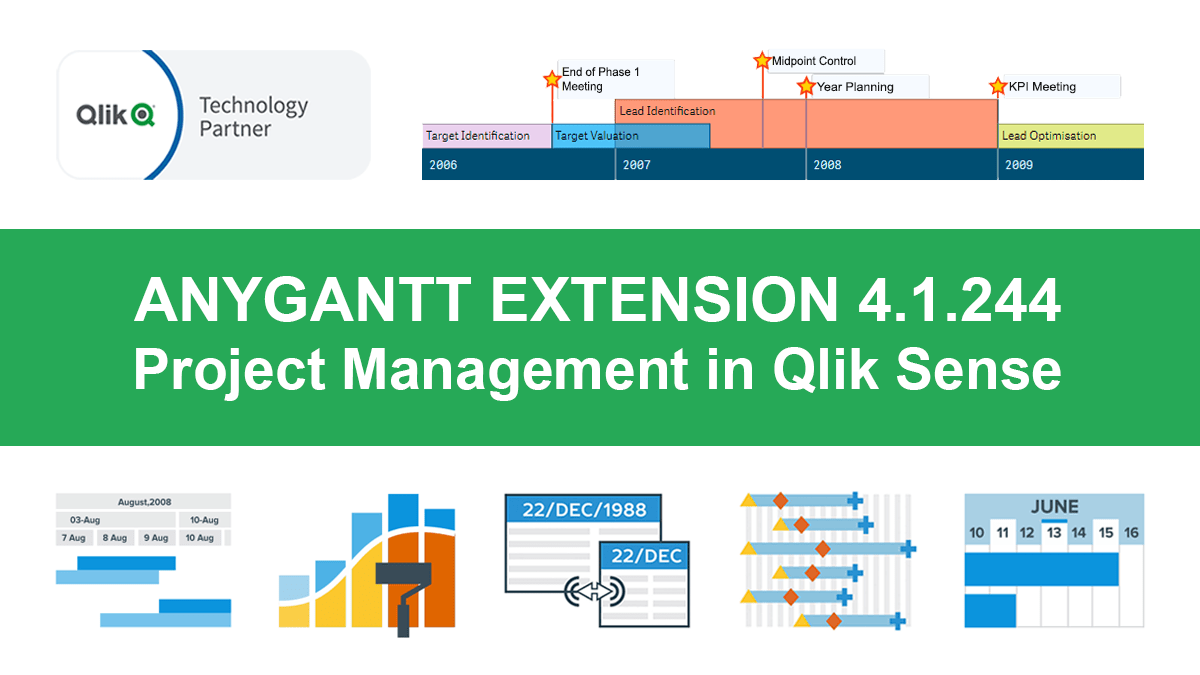 Hey Qlikkies, meet the awesome Qlik Sense Timeline Chart from AnyChart! We are excited to deliver it in the new, just-released version of our AnyGantt extension.
Hence the Timeline Chart has become — wait for it — the 40th chart type available in our data visualization extensions for Qlik Sense overall! For AnyGantt specifically it is the 3rd one, making AnyGantt a unique, cutting-edge Project Management Bundle for Qlik now comprising the Project Gantt Chart, Resource Chart, and Timeline Chart in a single intuitive extension.
However, it is not all great news. Release 4.1.244 also brings a bunch of other awesome features and improvements to the AnyGantt extension.
Read more at qlik.anychart.com »
- Categories: AnyChart Charting Component, AnyGantt, Big Data, Business Intelligence, Gantt Chart, News, Qlik
- No Comments »