PR: Rich Data Visualization is Now Available for Microsoft SharePoint Users
June 9th, 2009 by Anton BaranchukFor Immediate Release
Rich Data Visualization is Now Available for Microsoft SharePoint Users
Seattle, WA June 10, 2009 – The AnyChart Company, a leading provider of data visualization solutions, has announced an OEM agreement with CorasWorks for its AnyChart for SharePoint Product. Under the terms of this agreement the existing users of CorasWorks Data Integration Toolset will soon be able to take the full advantage of the rich data visualization functionality developed by AnyChart at no extra cost.
Read more »
- Categories: AnyChart Charting Component
- No Comments »
AnyChart 5.1.2 – JavaScript Data Manipulation
February 13th, 2009 by Timothy Loginov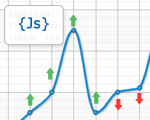 On 13th of February AnyChart is proud to release version 5.1.2 of AnyChart Flash Charting Component with JavaScript Data Manipulation Methods.
Please download the latest trial version from AnyChart Download Section.
AnyChart is based on XML data input, but if you’d like to create Data Streaming or fully Client Size interactive applications you can use Java Script data manipulation options. These methods allows you to add, remove or change the data points and data series in a single chart or in the chart that is a part of a dashboard. Also, you can highlight a point or a series, or select/deselect a point. Along with AJAX related functions you can create application that will give users the great option of run-time chart data editing.
Also, the special Dataplot Attributes can be used to update chart titles, footers and other texts on the chart.
Read more about JavaScript Data Manipulation in AnyChart Users Guide >>
Here is a bunch of samples that give you an overview of new features:
- Adding, Removing, Showing, Hiding Data Series
- Adding, Removing, Editing Data Points
- Selecting, Deselecting and Highlighting Data Elements

Oracle APEX Users can now use an updated AnyChart 5.1 Engine in their APEX Applications – 5.1.2 release features new integration kit. Please refer to Apex Evangelists: AnyChart 5 integration kit for APEX for more.
- Categories: AnyChart Charting Component
- No Comments »
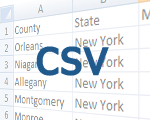
AnyChart 5.1.1 – CSV Data Support, Flash CS3 Charts
February 3rd, 2009 by Timothy LoginovJust in 10 days after the previous release – new 5.1.1 version has arrived. We’re happy to introduce several new features. “We’ve added feature-rich CSV support,” said Alex Batsuev, lead developer of AnyChart product. “This feature began as a customer request.” It allows to make data file smaller and decrease loading time. It is possible to reuse CSV tables in different series and dashboard views. Read more about CSV Data>>

Other AnyChart version 5.1.1 new features
- Adobe Flash Integration
New Feature – A set of samples making possible the use of AnyChart Charts, Maps and Gauges in Flash CS3.
Read more Flash CS3 Integration >> - Drag Ability for Scrollable Charts
New Feature – Drag Ability for Scrollable Charts. You can configure chart to make it draggable when the chart area is zoomed.
Read more about AnyChart version history and plans for new upcoming releases. Feel free to contact us with your comments, ideas and suggestions.
- Categories: AnyChart Charting Component
- No Comments »
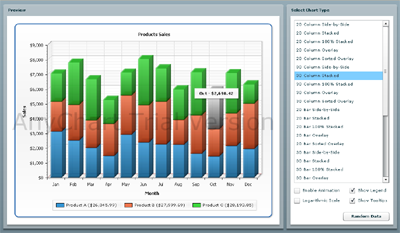
AnyChart 5.1 – new chart types, new features, significant performance improvements, and many more…
January 23rd, 2009 by Anton BaranchukWe’re happy to announce the production release of AnyChart 5.1 – the most advanced flash charting component. Version 5.1 builds on the success of the earlier 5.0 offering by adding several new chart types, new features, significant performance improvements plus new advanced dashboard features and Adobe AIR support.
New chart types: TreeMaps, HeatMaps, Funnel Charts both in 2D and 3D, Accumulation Pyramid (also known as Pyramidal Funnel) both 2D/3D, 3D Pie and Doughnut charts.
New features: Scrolling support, Multiple X Axes both for Categorized and Scatter plots, Markers in Legend, Interactive Labels, Multiple Data Labels Support, Multiple Data Tooltips Support, Multiple Data Markers, Context Menu Localization, Axis Markers Styling Support.
Another exciting news – Now AnyChart is fully compatible with Adobe Air ™. Build your RIA or Desktop Application utilizing the power of AnyChart Flash Charting engine. Also all chart types can now be combined within interactive dashboard: all charts, gauges, maps, funnels.
And the last, but not the least – Significant Performance Improvements. Read more »
- Categories: AnyChart Charting Component
- No Comments »
Apex Evangelists: AnyChart 5 integration kit for APEX
November 18th, 2008 by Anton BaranchukOur partners Apex Evangelists have published integration kit for our products and Oracle Application Express. We’re cross-posting that article here. Thank you, Apex Evangelists!!! Link to original post>>
A few days ago we released our Anychart 5 integration kit for Oracle Application Express (APEX).
Background
APEX has the ability to create (flash) charts. They are based on an older version of Anychart, version 3.3. Although these charts are already nice, there are some problems with it. You can’t do everything you want with it, you can’t print for ex, in short they look fine but not great.
Anychart released a while ago Anychart 5 which not only looks a lot nicer, but it resolved the problems and it has a lot more possibilities and features! Below, on the left, a chart created in APEX by using one of the predefined examples and on the right, the chart in Anychart 5 format.
 I hope these charts speak for themselves 😉 Read more »
- Categories: AnyChart Charting Component
- No Comments »
AnyChart and Apex Evangelists enter global partnership
September 24th, 2008 by Anton BaranchukAnyChart, the world leading company in data visualization, and Apex Evangelists, the world leading consulting company which 100% specializes in working with Oracle Application Express, announced today a global partnership to provide high quality customized data visualization solutions for Oracle APEX.
Apex Evangelists are extremely knowledgeable in all areas of Application Express development and have extensive experience of working with the AnyChart products.
Dimitri Gielis has announced about the partnership at Oracle Open World conference (post in his blog)
- Categories: AnyChart Charting Component
- No Comments »
AnyChart – charts for Google Chrome
September 3rd, 2008 by Alex BatsuevGoogle has released the new browser of the next generation – Google Chrome
It is amazing how fast it is, and also it has a lot of features in such minimal, simple and useful interface
But the most important news for our team is the fact that AnyChart works like a charm with Google Chrome!
And it is the good news for our customers as well – all their reporting, statistical, BI and other systems built with AnyChart will work in the new browser without any extra efforts.
- Categories: AnyChart Charting Component
- 2 Comments »
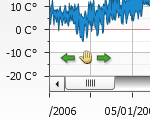
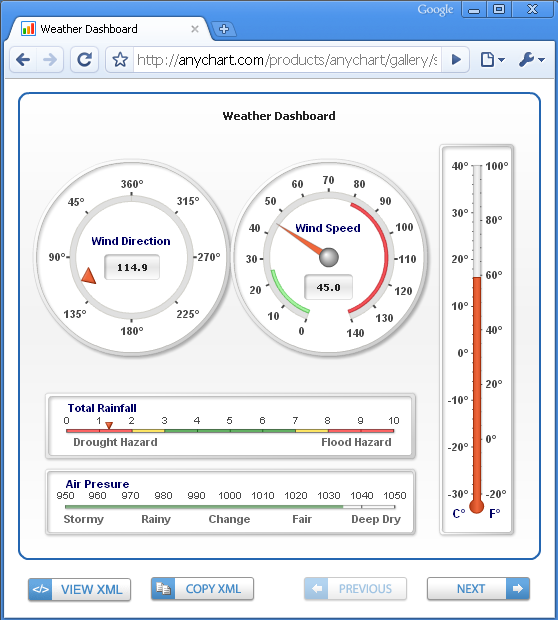
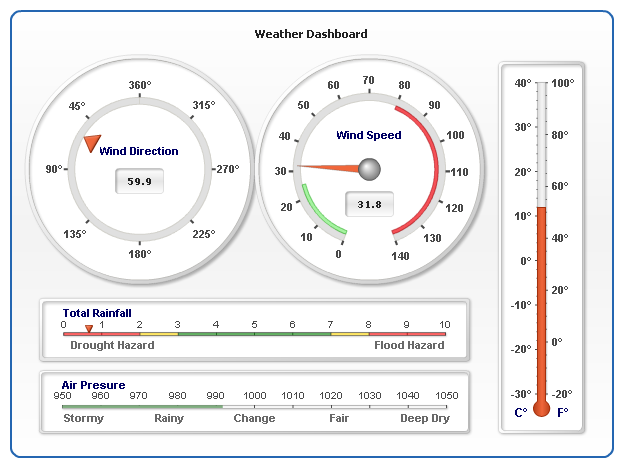
AnyChart 5.0 Release – featuring Interactive Circular (Angular) and Linear (Horizontal and Vertical) Gauges
July 24th, 2008 by Timothy LoginovOn July 25th, AnyChart Team is proud to present AnyChart version 5.0 with the multipurpose, feature rich Gauge engine.
Version 5.0 Release Overview:
- Gauges Charting Engine
- Circular (Angular) Gauges – variable angles, multiple scales, auto-fit.
- Linear Vertical and Horizontal – color ranges, multiple scales and pointers.
- Image Gauge – for nice look and total customization.
- Custom Labels – to add descriptions and annotations.
- Indicator Gauge – to represent device or business indicators.
- Bullet Graphs.
- Thermometer Styled Linear Gauges.
- Tank Styled Linear Gauges.
- Basic Charts Engine Improvements
- Exploded Slices for Single-Series Pie and Donut Charts.
- Sorting feature for Pie and Donut Charts.
- Dashed Grids and Lines.
- Opera Tooltip Redraw Bug Fixed.
- Map Tooltip Position in Flex Component Bug Fixed.
- Animation in Dashboard Mode Fixed.
Please take a look at the Gauge Samples in our Chart Gallery:
And do not miss an opportunity to test:
The trial version can be downloaded from Download Section.
Existing users eligible for the free or discounted upgrade – please contact support team to upgrade to version 5.0.
Here is a sample Gauges Dashboard created with AnyChart version 5.0:
- Categories: AnyChart Charting Component
- No Comments »
AnyChart for Adobe Flex 3 – advanced chart and map component
February 29th, 2008 by Alex BatsuevAnyChart component for Adobe Flex 3 is now available!
Now Flex developers have better alternative of Flex Charting for adding interactive charts, maps and diagrams into their applications. Our solution allows to build dashboard, reporting, analytical, statistical, financial or any other data visualization solutions with Adobe Flex 3. AnyChart is an advanced Flash based data-visualizataion solution, allowing everyone to utilize power of animation and ultimate interactivity.
It’s just a beta 1 version and we are open for your opinions and suggestions.
You can send them as a comments to this post or contact us directly (support@anychart.com).
You can download SWC library from here:
http://6.anychart.com/products/anychart/docs/platforms/flex/AnyChartTrialSWCComponents.zip
And please take a look at the following samples:
Sample #1: Chart types.
http://6.anychart.com/platforms/flex/samples/chartTypes/AnyChartFlexChartTypes.html
Source code of this sample is available here:
http://6.anychart.com/platforms/flex/samples/chartTypes/srcview/index.html
Sample #2: Sales map.
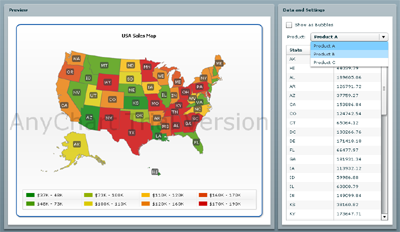
http://6.anychart.com/platforms/flex/samples/salesMap/AnyChartFlexSalesMap.html
Source code of this sample is available here:
http://6.anychart.com/platforms/flex/samples/salesMap/srcview/index.html
Sample #3: Yahoo Weather with AnyChart Flash Maps.
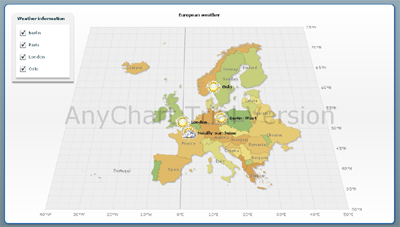
http://6.anychart.com/platforms/flex/samples/yahooWeather/YahooWeatherSample.html
Source code of this sample is available here:
http://6.anychart.com/platforms/flex/samples/yahooWeather/srcview/index.html
Quick start guide:
1. Download AnyChartFlexComponent.swc and add them to the “libs” folder of your project
2. Open your Flex application in the “Design” view.
3. Drag AnyCharFlex from Components panel to the stage (Custom->AnyChartFlex)
4. Open the “Code” view and write XML for the chart. e.g.
<ns1:AnyChartFlex x="10" y="10" width="550" height="400">
<ns1:anychartXML>
<mx:XML>
<anychart>
  <charts>
    <chart>
      <data>
        <series>
          <point name="pt1" y="10" />
          <point name="pt2" y="20" />
          <point name="pt3" y="30" />
          <point name="pt4" y="40" />
          <point name="pt5" y="20" />
        </series>
      </data>
    </chart>
  </charts>
</anychart>
</mx:XML>
</ns1:anychartXML>
</ns1:AnyChartFlex>
That’s it! Quick and Easy!
You can find complete XML reference here:
http://6.anychart.com/products/anychart/docs/xmlReference/index.html
Beta 1 provides full support of the AnyChart XML format, it means that all AnyChart features are available!
So – you are welcome to play with our demos and leave your comments! Your opinion is very important for us – Thank you!
- Categories: AnyChart Charting Component
- No Comments »
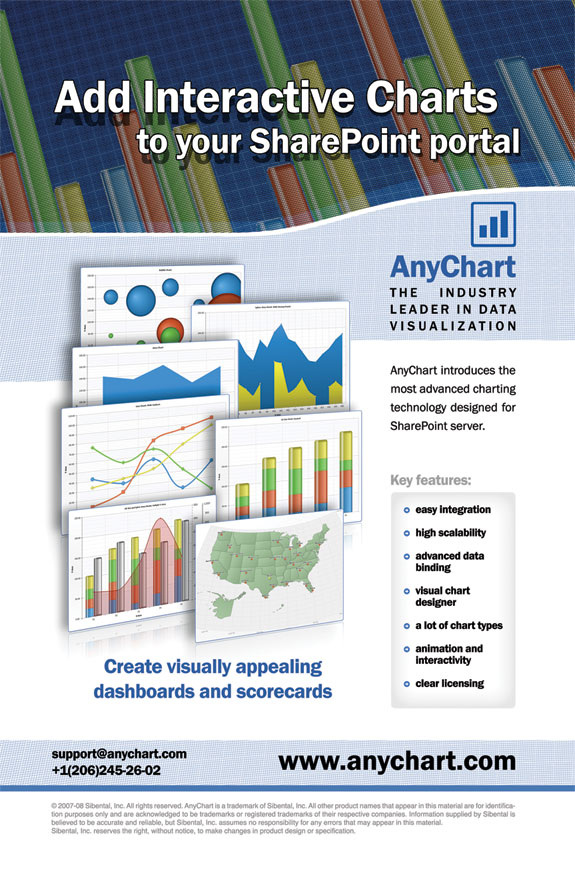
Add Interactive Charts to your Microsoft SharePoint portal
February 4th, 2008 by Anton BaranchukAnyChart announces new product – AnyChart for SharePoint!
That product will add advanced charting functionality to Microsoft SharePoint projects.
Key features:
– easy integration
– high scalability
– advanced data binding
– visual chart designer
– a lot of chart types
– animation and interactivity
– clear licensing
The product will be launched during March’08.
Interested in product? Want to participate in beta-testing program? Please contact us support@anychart.com
Create visually appealing dashboards and scorecards for SharePoint with AnyChart!
- Categories: AnyChart Charting Component
- No Comments »