Integrating AnyChart JS Charts in Python Django Financial Trading Dashboard
December 3rd, 2024 by Michael Whittle We are pleased to share an insightful article by Michael Whittle, a seasoned solution architect and developer with over 20 years of experience. Originally published on EODHD.com, it explores how he integrated our JavaScript charting library into a financial trading dashboard built with Python Django. Michael also shares his experience migrating a treemap from D3.js to AnyChart and explains why he chose our solution for implementing a stock chart, highlighting the intuitive code and enhanced functionality. Read on to discover how you can elevate your financial data visualizations in Python Django web applications with AnyChart JS Charts.
- Categories: AnyChart Charting Component, AnyStock, Big Data, Dashboards, Financial Charts, HTML5, JavaScript, Stock Charts, Third-Party Developers, Tips and Tricks
- No Comments »
Figures Without Any Charts — JS Chart Tips
September 23rd, 2024 by AnyChart Team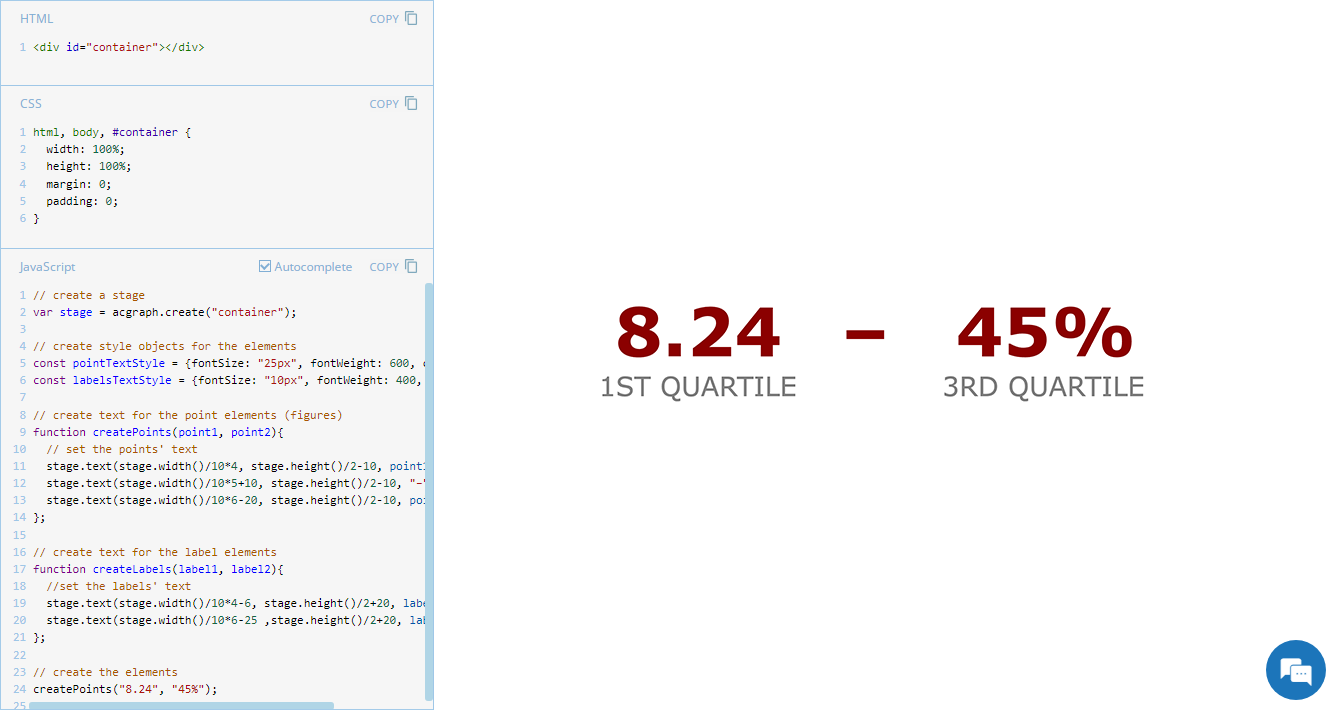 Exploring minimalistic data presentation, this entry of JS Chart Tips shifts focus from complex visualizations to effectively showing raw numerical data. While our JavaScript charting library is designed to enable compelling graphical data displays, sometimes simplicity provides clearer insights. Reflecting on a recent customer request handled by our Support Team, now we’ll delve into how to display figures in a straightforward and direct way without creating any charts, offering a streamlined alternative that may be suitable in specific contexts.
- Categories: AnyChart Charting Component, Dashboards, GraphicsJS, HTML5, JavaScript, JS Chart Tips, Tips and Tricks
- No Comments »