Pinch-to-Zoom in Stock Charts — JS Chart Tips
March 5th, 2025 by AnyChart Team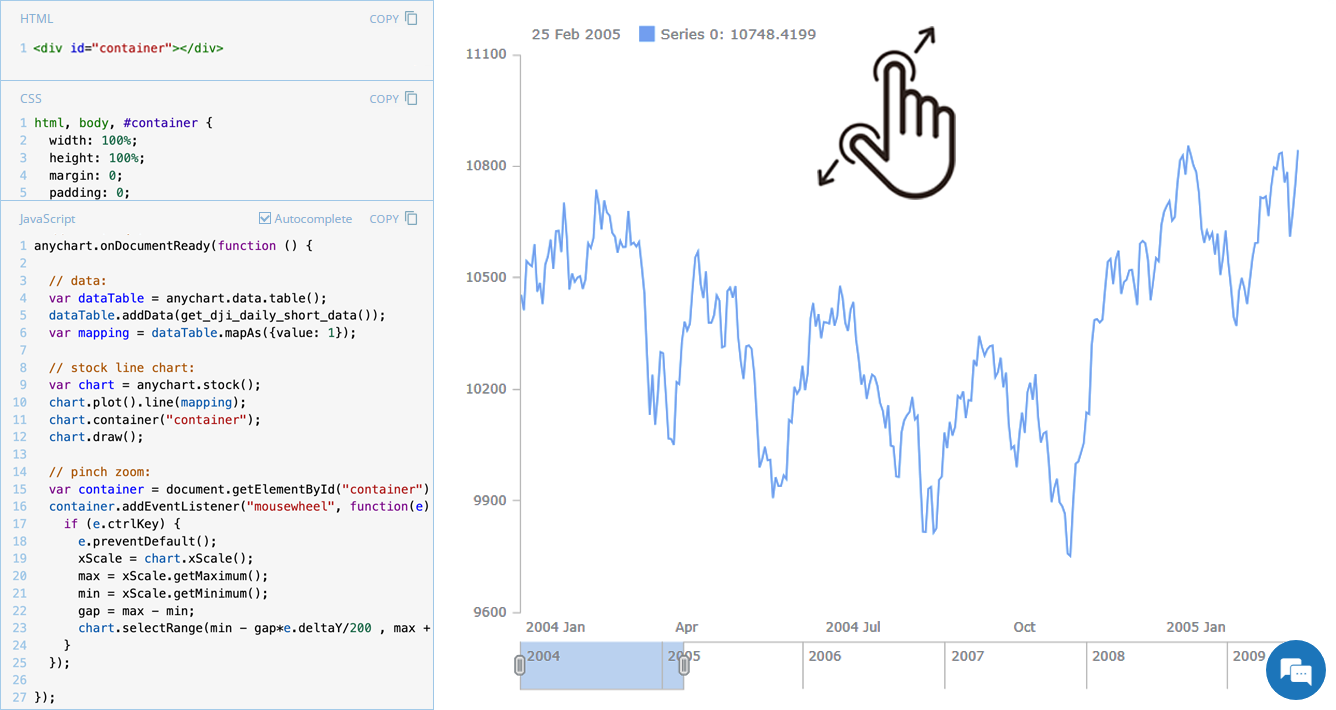 Stock charts are designed to handle large volumes of time-based data, and smooth navigation is key to working with them effectively. One common need is zooming — whether to focus on a specific time range in greater detail or to get a broader view of the data.
In our JavaScript stock charts, zooming works out of the box through the scroller element, which appears by default as the main navigational UI control, making it easy to adjust the visible range on the go. For even greater flexibility, the range selection UI provides extra tools like preset time period buttons and date input fields. You can also activate zooming via mouse wheel scrolling with the zoomOnMouseWheel() method, which corresponds to the two-finger swipe gesture on touchpads and trackpads.
Pinch-to-zoom is another intuitive zooming option. It allows users to zoom in and out naturally on mobile and touch devices by moving two fingers farther apart or closer together. This is also easy to implement — and it is exactly what we cover in this edition of JS Chart Tips. Learn how to add pinch-to-zoom to your JavaScript stock chart!
- Categories: AnyChart Charting Component, AnyStock, Big Data, Financial Charts, HTML5, JavaScript, JS Chart Tips, Stock Charts, Tips and Tricks
- No Comments »
Stock Chart with Custom Time Intervals — JS Chart Tips
January 30th, 2025 by AnyChart Team Grouping data points into appropriate time intervals is essential for making stock charts more readable and insightful. While raw data may be collected at a high frequency, such as every minute, financial analysts and traders often need to view broader trends, where grouping data into 5-minute, 15-minute, 1-hour, 1-day, and other time frames can provide clearer insights. In this edition of JS Chart Tips, we will walk you through the process of setting a custom time interval for a stock chart using our JavaScript charting library.
- Categories: AnyChart Charting Component, AnyStock, Big Data, Financial Charts, HTML5, JavaScript, JS Chart Tips, Stock Charts, Tips and Tricks
- No Comments »
Gantt Chart Legend — JS Chart Tips
November 21st, 2024 by AnyChart Team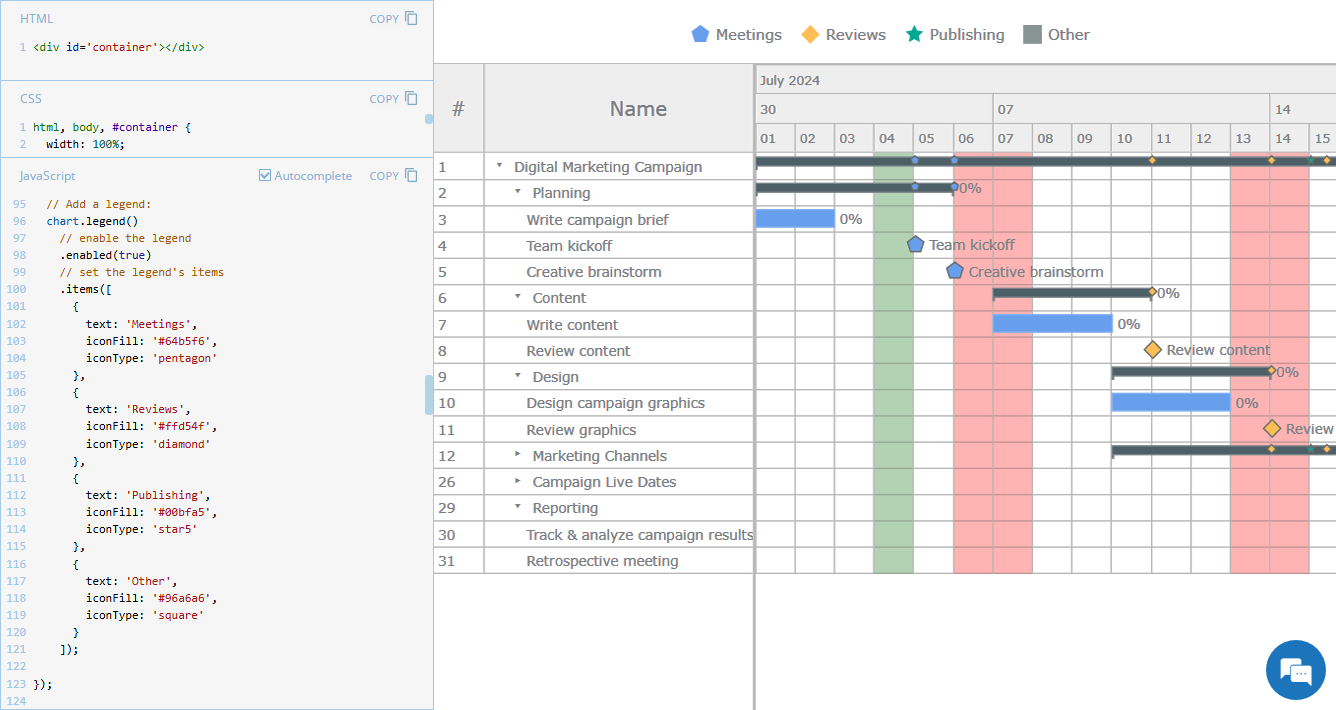 Legend is a vital element in many charts, helping viewers quickly understand what each visual component represents. However, it is not always a must-have for every chart type. For instance, Gantt charts often work perfectly fine without a legend, so it is not enabled in our JavaScript Gantt Chart by default. That said, creating one is straightforward. Right now, we will show you how to add a legend to a Gantt chart — join us as we continue our JS Chart Tips series, sharing quick solutions inspired by real customer queries!
- Categories: AnyChart Charting Component, AnyGantt, Business Intelligence, Gantt Chart, HTML5, JavaScript, JS Chart Tips, Tips and Tricks
- 2 Comments »