JavaScript Gantt Chart with Custom Data Grid Header Font — JS Chart Tips
August 20th, 2024 by AnyChart Team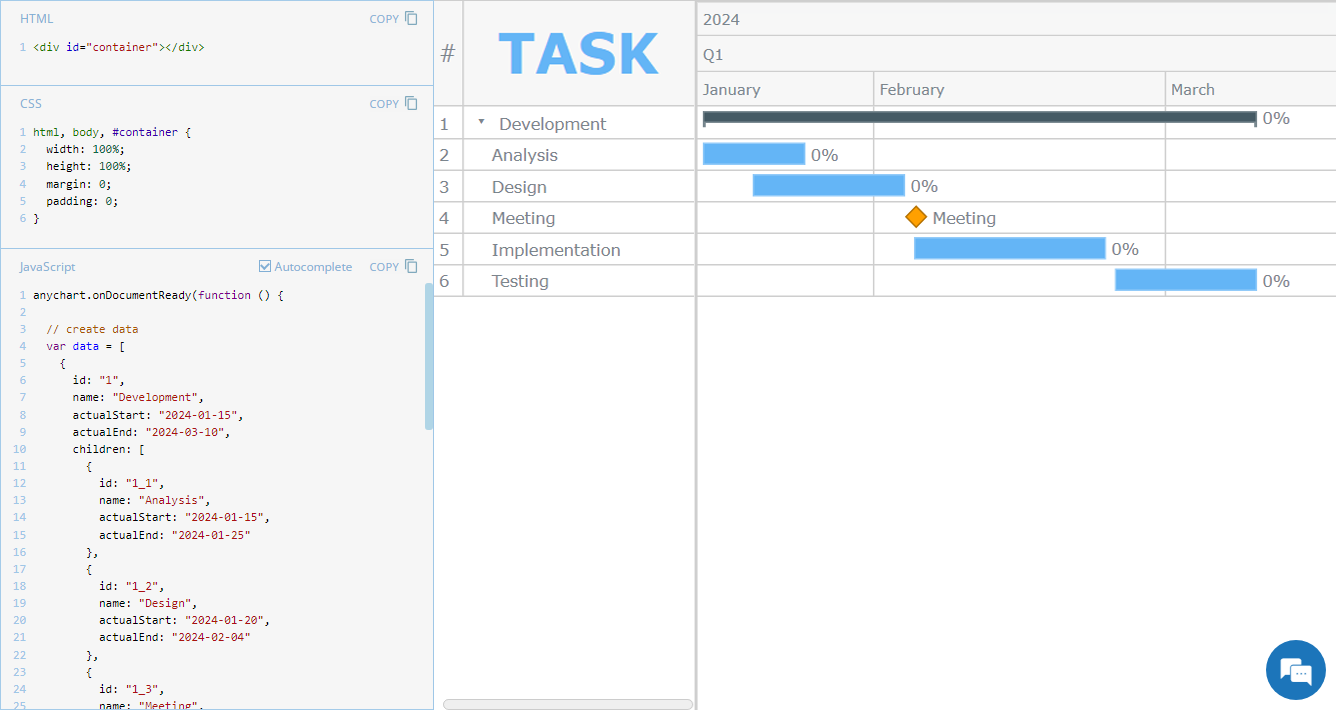 Hey everyone! We’re excited to launch a new regular feature on our blog called JS Chart Tips. In this series, we’ll share some recent cases handled by our Support Team for users of our JavaScript charting library, highlighting both frequent questions and those unique solutions that shouldn’t remain hidden.
Whether these scenarios directly resonate with a challenge you’re facing or simply spark an idea for your current or future data visualization development tasks, we hope you’ll find valuable insights. Each entry will include code snippets and JS chart examples to illustrate the solutions. If you get additional questions or need more details, simply comment below or contact our Support Team directly. We’re here to help enhance your JavaScript charting experience!
Without further ado, welcome to the first edition of JS Chart Tips! Today, you’ll learn how to customize the font of the data grid header in a JavaScript Gantt chart.
- Categories: AnyChart Charting Component, AnyGantt, Business Intelligence, Gantt Chart, HTML5, JavaScript, JS Chart Tips, Tips and Tricks
- No Comments »