Recap of the Week – 7/20/2015
July 20th, 2015 by Margaret SkomorokhThis week we have posted the following news on data visualization, data science, and AnyChart:
- This nice animated infographic by CNNMoney shows how the median home in America has changed of the past 40 years.
- Read the article by Explorer (UK) Ltd about AnyChart Pie Charts in Oracle Application Express (APEX).
- On July 23, 2015, a Big Data meeting will be held online. Participation is free, but you need to register in advance. The group is meant to be a hub for those involved in Big Data and Data Science in the world. Meetings will be monthly in online to discuss architecture, challenges, solutions , products and ideas that Big Data companies are facing and to learn from fellow Big Data professionals.
- Check out this animated map showing how Hinduism, Buddhism, Christianity, Judaism, and Islam spread across the world.
By the way, we are going to update AnyChart Maps – AnyMap in a matter of days, it will be a completely new, HTML5-ready JavaScript maps engine.
Stay tuned!
- Categories: AnyChart Charting Component, News
- No Comments »
Recap of the Week – 7/12/2015
July 12th, 2015 by Margaret SkomorokhHere is a quick recap of the interesting information on data visualization, which we have discovered this week – and, of course, of some AnyChart news:
- This incredibly detailed map shows how Europe’s population changed from 2001 to 2011. It is the first ever to collect data published by all of Europe’s municipalities, so it provides a level of detail previously unavailable.
- We have released AnyChart 7.5.1 – a new version of our HTML5 charts with some bugs fixed. Read more on our blog.
- In July 2015, a Coursera course in data visualization is back. This is an excellent opportunity for everyone involved to broaden their knowledge!
- How do you manage a remote team? Read tips from 6 experts (one of them is from AnyChart).
- Categories: AnyChart Charting Component, News
- No Comments »
AnyChart 7.5.1 Available – new version of our HTML5 charts
July 8th, 2015 by Margaret SkomorokhAnyChart 7.5.1, a bug fix release of our HTML5 charts, is now available. This version contains the following changes:
Improvements
- Improved the Animation feature.
Bug fixes
- Fixed the bug with multiple markers in Circular Gauges.
- Solved the issue with the min/max bubble size in Bubble Charts.
- Fixed the bug with Inside Labels incorrect overlapping in Pie Charts.
We are sorry for any inconveniences caused by the bugs. Our team is constantly working to improve AnyChart and achieve the best quality possible. And you’re always welcome to submit any questions to our support system.
AnyChart version history: https://www.anychart.com/products/anychart/history/
Trial download: https://www.anychart.com/download/
- Categories: AnyChart Charting Component, HTML5, JavaScript, News
- 1 Comment »
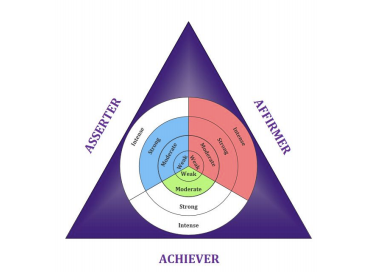
Sparks & Associates Chooses AnyChart to Visualize Assessment Results using JavaScript pie chart
July 3rd, 2015 by Margaret SkomorokhToday we are glad to publish a new customer success story – about AnyChart and Sparks & Associates.
 The Actualized Leadership Profile (ALP) is a 77-item self assessment that measures an individual’s dominant motive need and corresponding style of leadership. Based on the seminal works of Abraham Maslow and David McClelland, the ALP measures the degree of self-actualization that is demonstrated in one’s current style of leadership. A customized, full color and confidential report identifies the strengths and limitations in the individual’s current leadership approach.
The challenge was:
- To provide a creative and intuitive visualization of personal assessment results.
- To create a visualization that accepts result parameters from the system’s existing ASP code.
Solution:
- AnyChart JavaScript (HTML5) component was chosen as a solution. The flexibility of the AnyChart.graphics technology allowed to nest several pie charts and create a multi-level JavaScript pie chart not available from other chart vendors.
- AnyChart provides the flexibility to use customized background visualizations.
You can enjoy the full success story here:
|
Sparks & Associates Sparks & Associates Chooses AnyChart to Visualize Assessment Results >> |
Or see other AnyChart Customer Success Stories.
- Categories: AnyChart Charting Component, HTML5, JavaScript, News, Success Stories
- No Comments »
Top 5 Books about Data Visualization and Charting
June 30th, 2015 by Anton BaranchukEvery day at AnyChart we deal with a lot of different data visualizations, charts, diagrams, dashboards when we help our clients to build their beautiful products. So, we have a lot of experience with both Flash and HTML5 charts, but also we recognize power of reading to get theoretical understanding of basic concept from guru-thinkers. Here are our top 5 picks: Read more »
- Categories: AnyChart Charting Component, Books, Business Intelligence, Dashboards, HTML5, JavaScript, Tufte
- No Comments »
AnyChart 7.5.0 and AnyGantt 7.5.0 Released – new version of our HTML5 charts
June 18th, 2015 by Margaret SkomorokhGood news! Today we have two major releases of our HTML5 charts for our customers: AnyChart 7.5.0 and AnyGantt 7.5.0. In the new versions of our components, you will find the Funnel and Pyramid chart types, Dashbording Tools, the Printing and Animation options, and other significant improvements. Check them out:
AnyChart 7.5.0 New Features
 |
Dashboarding Tools The purpose of Dashboarding Tools is to provide simple and convenient instruments for building complex Dashboards. In the current release we present the first part of this set: the ability to highlight/hide series and points, using special methods. See API Reference for more details >> |
 |
Printing The new printing method allows you to make a full-page print of a chart or a dashboard. It supports eight paper size formats: US Letter, A0 – A6, and the portrait/landscape switch. Read more about Printing >> |
 |
Animation Most popular charts types – Line, Column, Bar, Area, and so on – are now animated. Animation supports duration settings and start&finish events. Take a look at the Gallery samples >> |
 |
Funnel Charts Funnel charts (also called accumulation charts) show percentage ratio. They are often used to represent different stages in sales process and show the amount of potential revenue for each stage. Read more about Funnel Charts >> Take a look at the Gallery samples >> |
 |
Pyramid Charts Pyramid charts are used to visualize the hierarchical structure of topics, and progressively ordered quantitative data. Read more about Pyramid Charts >> Take a look at the Gallery samples >> |
AnyGantt 7.5.0 New Features
 |
Printing The new printing method allows you to make a full-page print of your chart. It supports eight paper size formats: US Letter, A0 – A6, and the portrait/landscape switch. Read more about Printing >> |
 |
Events Events allow to handle such user actions as rowClick, rowMouseOver, rowMouseMove, etc. with the .listen() and .listenOnce() methods. Using this methods, you can override default chart interactivity. |
 |
XML/JSON/CSV Data Support The XML and JSON formats can be used for data and settings input; CSV can be used for data input. XML and JSON schemas are available. Learn how you can work with data >> |
 |
Summary Tasks Auto-Calculation The actualStart, actualEnd, and progressValue data fields of grouping tasks became optional. If they are missing, auto-calculation is done, based on tasks in the group. Take a look at the Gallery sample >> |
AnyChart version history: https://www.anychart.com/products/anychart/history/
AnyGantt version history: https://www.anychart.com/products/anygantt/history/
Trial download: https://www.anychart.com/download/
- Categories: AnyChart Charting Component, AnyGantt, Dashboards, Gantt Chart, HTML5, JavaScript, News
- No Comments »
DeviceLock Chooses AnyChart HTML5 charts for Its DLP Security Solution
June 11th, 2015 by Margaret SkomorokhWe are happy to announce that a new customer success story has been added to our site.
 DeviceLock, Inc, established in 1996, is a leading provider of endpoint device/port control and data leak prevention software for business, education and government institutions around the world. The company offers DeviceLock, a policy-based endpoint data leak prevention (DLP) security solution that enables network administrators to centrally control uploading and downloading activity through local computer devices and network protocols and applications.
The challenge was:
- To present the activity of DeviceLock in a clear and visually appealing way.
- To make complex data easy to read and understand so that the situation could be quickly evaluated by the end user.
Solution:
- AnyChart JavaScript charts were chosen as a solution. The component allows to create stylish interactive HTML5 charts and provides excellent rendering performance.
- Due to wide variety of chart types and the flexibility of AnyChart, it was possible to implement user-friendly data visualizations.
You can enjoy the full success story here:
|
DeviceLock DeviceLock Chooses AnyChart for Its DLP Security Solution >> |
Or see other AnyChart Customer Success Stories.
- Categories: AnyChart Charting Component, Business Intelligence, HTML5, JavaScript, Success Stories
- No Comments »
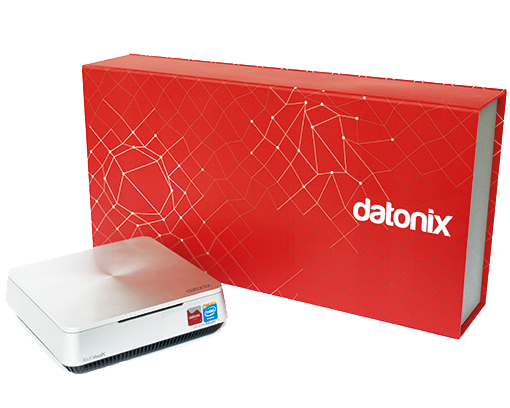
New Partnership Announcement: Datonix and AnyChart
May 22nd, 2015 by Margaret SkomorokhWe are very pleased to announce that AnyChart have partnered with Datonix.
Datonix primary product is datonixOne, a computer appliance designed for BIGDATA Solutions and eXpress development. Using datonixOne, Federated BIGDATA applications can be quickly developed, providing ready information for end users.
AnyChart partners: https://www.anychart.com/partners/.
- Categories: AnyChart Charting Component, Success Stories, Third-Party Developers, Uncategorized
- No Comments »
AnyChart 7.4.1 Update Available
May 15th, 2015 by Timothy LoginovIn the AnyChart 7.4.1 update, we have added a lot of great features and improvements including a major upgrade of Legend API. Here is the full list of improvements and bug fixes:
New Features
- Each AnyChart element (Title, Label, Legend, Point, etc.) now dispatches mouse events. See Base API Reference for more details.
- Rewritten the anychart.bubble and anychart.marker methods: now they create Scatter Charts instead of Cartesian.
- Added the ability to set the maximum/minimum size for charts and other elements via the maxWidth/maxHeight and minWidth/minHeight methods.
- Fully rewritten anychart.ui.Table API.
- Pie Charts now work with CSV data.
Legend API Improvements
(For more information, see the Legend API Reference.)
- Removed the itemsProvider method.
- Added the itemsSourceMode method, allowing a set of legend items to switch between series and categories.
- Added the items method, allowing to create a custom set of legend items.
- Added the itemsFormatter method, allowing to customize the default set of legend items.
- Added the itemsTextFormatter method, allowing to customize the text of legend items.
- Added the hoverCursor method, allowing to customize the behavior of the cursor.
- Added the inverted method, allowing to invert the sequence of legend items.
- Added the legendItem method for all series, allowing to customize legend items.
Legend Interactivity Improvements
(For more information, see the Legend section in our User’s Guide.)
- A series is highlited when a legend item is hovered.
- A series is disabled when a legend item is clicked.
- Added an easy way to customize the default behavior via the preventDefault and stopPropagation methods.
Other Improvements
- The default interactivity now works the same in all chart types (Radar/Polar, Cartesian, Scatter, etc.).
- Circular Gauges: drawing improved.
Bug fixes:
- Solved problems with multiple lines in texts (\n\n).
- Tables are now redrawn when internal settings of charts are changed.
- Y-scale is no longer inverted in Win/Loss series.
- Changing the orientation of a Bullet Chart no longer causes the drawing bug.
- Solved problems with drawing multiple axes in Cartesian and Scatter Charts.
- Fixed the bug with Tooltips padding.
- Hover settings for Data Labels now can be set from Data.
- Fixed the bug with drawing Grids in IE6-8 (VML).
- Fixed the bug with the position of Tooltips in IE6-8 (VML).
AnyChart version history: https://www.anychart.com/products/anychart/history/
Trial download: https://www.anychart.com/download/
- Categories: AnyChart Charting Component
- No Comments »
AnyChart 7.4.0 Available
March 30th, 2015 by Margaret SkomorokhA new version of our component – AnyChart 7.4.0 – is available for download. We have implemented a number of important features including 4 new chart types: Sparkline, Error, Box&Whisker, and Circular Gauges. Check out the main improvements:
 |
Sparkline Charts Sparkline charts are designed to fit a lot of them in a tiny space. Sparklines are good at presenting changes in time for an array of similar data, e.g. currency or medical trends. Read more about Sparkline Charts >> Take a look at Gallery sample >> |
 |
Error Charts Error Charts are to be used as error or deviation indicators. Error bars often represent one standard deviation of uncertainty, one standard error, or a certain confidence interval. Read more about Error Charts >> Take a look at Gallery sample >> |
 |
Box and Whisker Charts Box Charts are predominantly used in descriptive statistics. Using a box chart is a way of representing groups of numerical data. Boxes operate with specific terms, such as whiskers, quartiles, and median. Read more about Box and Whisker Charts >> Take a look at Gallery sample >> |
 |
Circular Gauges Circular Gauge is a radial chart that can be used as a clock, speedometer, compass, audio feature tuner or any other gauge that represents the value as an angle on a circle plot. Read more about Circular Gauges >> Take a look at Gallery sample >> |
 |
Pie/Donut Aqua Style Aqua Style for Pie/Donut charts is a renewed gradient fill style which has become very popular among our users since AnyChart 5.0. Take a look at Gallery sample >> |
- Categories: AnyChart Charting Component
- No Comments »