 From clocks to weight scales, speedometers to thermostats, and even the battery charge icon on your phone, Gauge Charts are widely used to represent a value on a scale or range, providing a clear visual indication of the represented measurement. Gauges can be circular or linear, and in this article, our focus will be on the latter style. I will guide you on how to create a cool linear gauge using JavaScript.
Specifically, we will explore the demonstration of linear gauges using an example of a real-time typing speed test. Throughout the article, we will delve into the structure of linear gauges, discuss styling options, explore how they can be connected to data, and show how you can easily build your Linear Gauges using JavaScript in just a matter of minutes. By the end of the tutorial, you’ll have an awesome example of a linear gauge used to dynamically illustrate typing speed test results or whichever data you want.
So, let’s dive in and elevate your web-based interactive data visualization game!
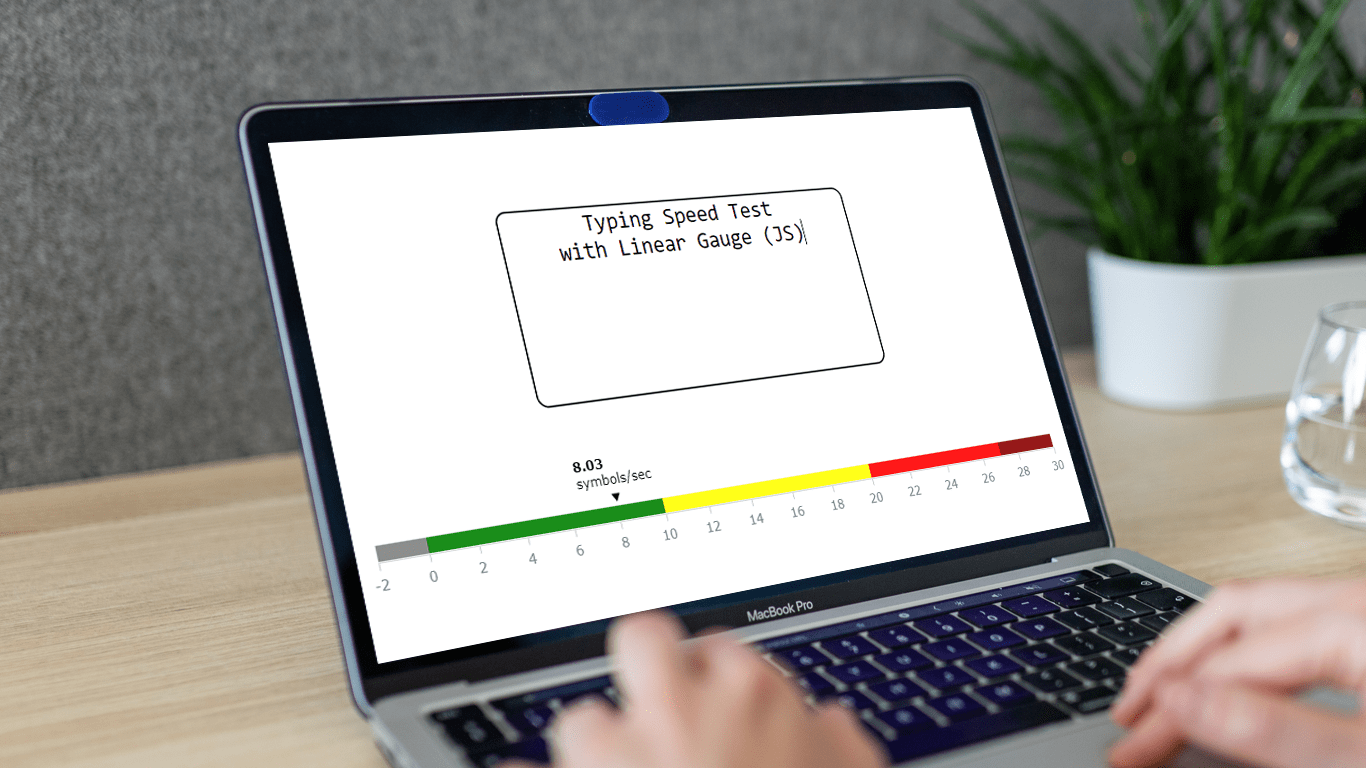
Linear Gauge Preview
Behold a preview of our JS linear gauge-based typing speedometer, a captivating visualization we will build together in this tutorial.
1. Creating a Basic Linear Gauge Chart
First, we’ll go through the steps to quickly create a basic Linear Gauge chart using JavaScript. Let’s get started!
1.1. Make a Simple HTML Page
Every web page starts with an HTML scaffold, and so does our demo.
<!DOCTYPE html>
<html lang="en">
  <head>
    <meta charset=UTF-8/>
    <meta name="viewport" content="width=device-width, initial-scale=1.0" />
    <title>Typing Speed Test</title>
    <style>
      html,
      body,
      #container {
        width: 100%;
        height: 100%;
        margin: 0;
        padding: 0;
      }
    </style>
  </head>
  <body>
    <div id="container"></div>
  </body>
</html>
Our linear gauge will be put in a div provided with the ID container. In the head tag, I’ve included the style tag with the rules for this element’s width and height, as well as margin and padding, which you can adjust to fit your needs.
1.2. Connect JavaScript Charting Library
Now that our HTML page with a container is all set, it’s time to integrate the JavaScript charting library of our choice into the mix.
For this tutorial, I am using AnyChart JS Charts, which provides excellent support for linear gauges, allowing us to create stunning interactive charts with its pre-built capabilities effortlessly.
To connect the charting library, we need to add the necessary scripts to the head section of our HTML file. Specifically, we’ll include two lightweight modules required to work with linear gauges.
<script src="https://cdn.anychart.com/releases/8.11.1/js/anychart-core.min.js"></script>
<script src="https://cdn.anychart.com/releases/8.11.1/js/anychart-linear-gauge.min.js"></script>
1.3. Code JS Linear Gauge
Now comes the exciting part: write some JavaScript code to bring our linear gauge to life!
1.3.1. Build Foundation
Before we dive into the magical world of interactive gauges, let’s ensure a smooth sailing experience by setting up a main function that waits for the document to be fully loaded before executing the JavaScript charting code.
<script>
  anychart.onDocumentReady(function () {
    // The following JS code will be placed right here.
  });
</script>
Now that we’ve got it in place, it’s time to create the main chart object. We’ll be using the anychart.gauges.linear() function, which does exactly what it says: creates a linear gauge chart.
var gauge = anychart.gauges.linear();To make things look just the way we want, we’ll specify the layout of our gauge as horizontal using the layout() method on the chart variable.
gauge.layout("horizontal");1.3.2. Load Data
It’s time to breathe life into our linear gauge chart by adding some data. In the near future, when we have our live typing speed test tool up and running, this chart will showcase real-time data. But for now, let’s have some fun with placeholder values. We’ll use the data() method on the gauge variable and set the value to, say, 18.
gauge.data([18]);1.3.3. Configure Scale and Axis
Let’s shape the behavior of the gauge by defining its scale and axis. This will give us control over the value’s display.
To begin, we’ll set up the scale for the chart, specifying the minimum value (-2) and the maximum value (30). Additionally, we’ll set the interval between ticks to 2 so our chart will display ticks at each step of two units.
var scale = gauge.scale();
scale.minimum(-2);
scale.maximum(30);
scale.ticks().interval(2);
Now that we have our scale all sorted, let’s focus on configuring the axis. We’ll give it a gentle 5% offset, ensuring it perfectly aligns with the gauge. As for its orientation, we’ll choose bottom so the axis appears at the bottom.
var axis = gauge.axis(0);
axis.offset("5%");
axis.orientation("bottom");
1.3.4. Set Scale Bar
It’s time to add a touch of elegance to our linear gauge with some nice scale bars! It’s like giving the chart a fancy ruler to measure its enchanting powers. Let’s get started!
First, we’ll create a scale bar using the scaleBar() method, and since it’s the first scale bar, we’ll pass 0 as the parameter.
var scaleBar = gauge.scaleBar(0);Now, let’s paint the scale bar a beautiful color using the fill() method. Why not grace this example with the charming shade of lightBlue 0.9?
scaleBar.fill("lightBlue 0.9");We can utilize the width() method to determine the scale bar’s width. In our example, we’ll set it to 5%.
scaleBar.width("5%");1.3.5. Add Pointer
Now, let’s add an essential element of any linear gauge — the pointer. It will indicate and visualize the data on the gauge scale. See how to bring it to life.
To begin, we’ll create a marker pointer by calling gauge.marker(0), designating it as the first marker:
var pointer = gauge.marker(0);Now, it’s time to sprinkle some color on the pointer! We’ll use the color() method and set its value to black:
pointer.color("black");To ensure that the pointer plays nicely with other chart elements, we can use the zIndex() method. For this case, we’ll set its stacking order to 1.
pointer.zIndex(1);1.3.6. Draw Gauge
It’s time to bring our JavaScript linear gauge to life with just a few more touches.
We’ll use the container() method to specify the ID of the HTML element that will proudly hold the gauge.
gauge.container("container");Now, the moment we’ve been waiting for: initiating the drawing of the resulting JS-based linear gauge To do this, we’ll call the draw() method on the gauge variable:
gauge.draw();And just like that, the magic unfolds! Our web page is now adorned with a basic JavaScript Linear Gauge chart, complete with a delightful scale bar, finely marked ticks, and an alluring pointer. Check it out below and, with the full code, on the Playground.
We’ve come a long way on this web development journey, but there’s still more to explore. Let’s continue fine-tuning and enhancing our linear gauge, creating a captivating and interactive user experience for the upcoming typing speed test.
2. Customizing Linear Gauge
Now that our JS linear gauge is functional, it’s time to elevate its appearance and make it truly shine! Let’s transform our chart into an informative, colorful, and visually appealing data visualization masterpiece.
2.1. Arrange Colors
To infuse our chart with a delightful array of colors, we’ll use the anychart.scales.ordinalColor() method to create a color scale. By using the ranges() method, we can define color ranges and assign corresponding colors to them.
var scaleBarColorScale = anychart.scales.ordinalColor().ranges([
  {from: -2, to: 0, color: ["grey 0.9"]},
  {from: 0, to: 10, color: ["green 0.9"]},
  {from: 10, to: 20, color: ["yellow 0.9"]},
  {from: 20, to: 27, color: ["red 0.9"]},
  {from: 27, to: 30, color: ["darkRed 0.9"]}
]);
This custom color scheme will give the gauge’s scale bar distinct colors based on the defined intervals, making it visually rich and easier to interpret.
To apply the color scheme and set the width of the scale bar, we can use the colorScale() method on the scaleBar object:
scaleBar.colorScale(scaleBarColorScale);In addition, let’s also make the gauge’s background transparent:
gauge.background("transparent");2.2. Adjust Pointer
Now, let’s fine-tune the appearance of the pointer. We’ll use the type() method to set it as triangle-down, giving it a downward-pointing triangle shape:
pointer.type("triangle-down");We can adjust the offset using the offset() method to align the pointer perfectly. By setting it to -5%, the marker will be positioned just the way we desire, relative to the scale bar’s width:
pointer.offset("-5%");Explore other marker types and experiment with offsets to achieve your desired visual alignment.
2.3. Append Label
To enhance the visualization further, we can add a personalized and visually appealing label for the linear gauge pointer using the labels() method.
By calling pointer.labels() we’ll access all the labels associated with the pointer (well, we’ll only use one).
var labels = pointer.labels();Then, we can apply the desired configurations:
First, we’ll enable the label display.
labels.enabled(true);Next, we’ll set the font color to black, ensuring a clean and legible appearance.
labels.fontColor("#black");To position the label perfectly, we can adjust its vertical position with an offset of -10%.
labels.offsetY("-10%");We’ll also enable HTML formatting to easily customize the label content.
labels.useHtml(true);Finally, we’ll dynamically define the labels’ content and format it using simple HTML. In this example, the value will be displayed in bold, followed by the text symbols per second.
labels.format(function () {
  return `<b>${this.value}</b> <br> symbols/sec`;
});
With these stylish configurations in place, our JavaScript-based linear gauge will shine brighter than ever! See it right below and experiment with it on the Playground.
Feel free to add your data and enjoy! But we are not stopping here in this tutorial and will check out a nice example. Let’s make this linear gauge work for a typing speed test!
3. Building Typing Speed Test with Linear Gauge
Let’s create an engaging real-time typing speed test user interface and connect it to our shining linear gauge, turning it into a dynamic speedometer that visualizes the results on the fly!
3.1. Compose Typing Speed Test UI
First, we’ll add some HTML elements to the demo. Then, we’ll update the CSS styles to make them look good.
3.1.1. Build HTML Elements
To bring our typing speed test demo application UI to life, let’s add the following elements:
- A
textareaelement, where the user can enter text to measure the speed of typing. - A
buttonto restart the test, allowing users to retake the typing challenge. - An
h2line of text to display the results, showcasing the user’s typing speed. Divelements with IDs of wrapper and display to provide a structured layout.
<body>
  <div id="wrapper">
    <div id="display">
      <textarea
        type="text"
        placeholder="Enter up to 125 symbols"
        id="displayInputField">
      </textarea>
      <h2 id="resultText">_SCORE_</h2>
      <button id="restartTest">Test again!</button>
    </div>
    <div id="container"></div>
  </div>
</body>
3.1.2. Update CSS
Let’s update the CSS with the following rules to ensure our new HTML elements are displayed correctly and create an engaging user interface.
The wrapper element comprises two main parts of a demo: the typing speed test UI (display) and the chart container (container).
#wrapper{
  width: 100vw;
  height:100vh;
  display: grid;
  grid-template-rows: 2fr 1fr;
}
The display element contains a text area, results, and a reset button.
#display{
  width: 100%;
  height: 100%;
  display: grid;
  text-align: center;
  place-items: center;
}
The displayInputField is a text area where the user inputs text for speed measurement.
#displayInputField{
  width: 50%;
  height: 50%;
  min-width: 200px;
  min-height: 100px;
  text-align: center;
  font-size: 22px;
  resize: none;
  border-radius: 10px;
}
The resultText and restartTest are h2 text and button elements that appear after the test.
#resultText, #restartTest{
  display: none;
  font-family: "courier new";
}
After following the steps, our web page will display an elegant Typing Speed Test UI.
3.2. Add Interaction and Interactivity
Now that all the elements are in place, let’s infuse some JavaScript magic and connect everything! With our JavaScript logic, we’ll keep track of time and the symbols the user enters. Once the user types 125 symbols, brace yourself for the big reveal — the results will dazzle before their eyes, along with a handy button to restart the test for more typing fun!
// ceate a symbol counter
var numberOfSymbolsEntered = 0;

// create a typing speed test
var speedTypingTest = function(gauge){

  // get dom elements
  var inputFieldElement = document.getElementById("displayInputField");
  inputFieldElement.focus();
  var restartButton = document.getElementById("restartTest");
  var scoreHeader = document.getElementById("resultText");

  // instantiate app variables
  var symbolsPerSecond = 0;
  var iterationCounter = 0;
  var isCounterOn = false;

  // calculate symbols per second rate
  var getSymbolsPerSecond = function(){
    if(isCounterOn){
      symbolsPerSecond = (numberOfSymbolsEntered/(iterationCounter / 10)).toFixed(2);
      gauge.data().set(0,"value", symbolsPerSecond);
    }
  }

  // instantiate a timeout id
  var timeoutID;

  // create a timer counter function
  var startTimerCounter = function(){
    iterationCounter++;
    timeoutID = setTimeout(startTimerCounter, 100);
    if(!isCounterOn){
      clearTimeout(timeoutID);
    }
  }

  // start a new session of the typing speed test
  var startSpeedTypingTest = function(){

    // turn on the timer
    if(!isCounterOn){
      isCounterOn = true;
      startTimerCounter();
    }

    // turn off the timer, hide input field, and show results
    if(numberOfSymbolsEntered >= 125){

      // switch the counter boolean
      isCounterOn = false;

      // show a reset button and set it in focus
      restartButton.style.display = "block";
      restartButton.focus();

      // show a deadline text and add a final value
      scoreHeader.style.display = "inline-block";
      scoreHeader.textContent = `You are typing ${symbolsPerSecond} symbols per second`;

      // hide the text area dom element and disable its functionality
      inputFieldElement.style.display = "none";
      inputFieldElement.removeEventListener("input", startSpeedTypingTest);

    }

    // update the counter of entered symbols and calculate the rate per second
    numberOfSymbolsEntered++;
    getSymbolsPerSecond();

  }

  // start the typing speed test by typing in the text field
  inputFieldElement.addEventListener("input", startSpeedTypingTest)

  // restart the test by clicking the button
  restartButton.addEventListener("click", function(){

    // reset the variables to the initial values
    iterationCounter = 0;
    symbolsPerSecond = 0;
    numberOfSymbolsEntered = 0;

    // reset the apperance and values of the dom elements
    inputFieldElement.value = "";
    restartButton.style.display = "none";
    scoreHeader.style.display = "none";
    inputFieldElement.style.display = "block";

    // set the input in focus and add functionality
    inputFieldElement.focus();
    inputFieldElement.addEventListener("input", startSpeedTypingTest)

    // reset the gauge's marker to the initial value
    gauge.data().set(0,"value", 0);

  })

}
We won’t dwell too much on this custom JavaScript code within this tutorial. The main focus here is on the exciting ability to change the data of your Linear Gauge using JavaScript dynamically.
To connect this functionality to the chart, we’ll change the data to a dynamic variable and apply the logic after the gauge has been drawn.
anychart.onDocumentReady(function () {
  ...
  // add data
  gauge.data([numberOfSymbolsEntered]);
  ...
  // initiate the drawing of the linear gauge
  gauge.draw();

  // initialize typing speed test
  speedTypingTest(gauge);

});
Voilà! Our typing speedometer demo is now fully functional and ready to impress. Enjoy a delightful typing experience with real-time linear gauge visualization and accurate speed measurement, and you are more than welcome to play with the code on the Playground.
Conclusion
You have now learned how to create a stunning Linear Gauge chart (and a fun Typing Speed Test feeding data to it in real-time) using JavaScript. Don’t forget to check out the documentation for more in-depth information about linear gauge development. Happy gauging and exploring!
Don’t miss our other JavaScript charting tutorials.
Got an idea for a guest post? let’s make it work!
- Categories: AnyChart Charting Component, Big Data, Charts and Art, HTML5, JavaScript, JavaScript Chart Tutorials, Tips and Tricks
- No Comments »