 Creating a vibrant network graph in JavaScript might seem like crafting a digital cosmos: intricate, fascinating, yet entirely within reach. Whether you’re aiming to illustrate the complex interconnections within a galaxy, a social network, or the internal hierarchy of a multinational corporation, network graphs serve as a powerful tool to bring data to life, revealing hidden patterns and insights through visual representation.
Let’s embark on a journey to demystify the process, guiding you step-by-step on how to construct your very own network graph, with the Solar System as our illustrative example.
Unraveling Network Graph Cosmos
Network graphs are not just charts; I like thinking about them as stories told in dots and lines, each node a character, and each edge a relationship.
Imagine plotting the vast expanse of the solar system, where planets orbit the life-giving Sun and moons dance around their planets, forming a complex yet orderly network of celestial bodies. This is what network graphs excel at: turning abstract connections into a sort of map you can visually explore.
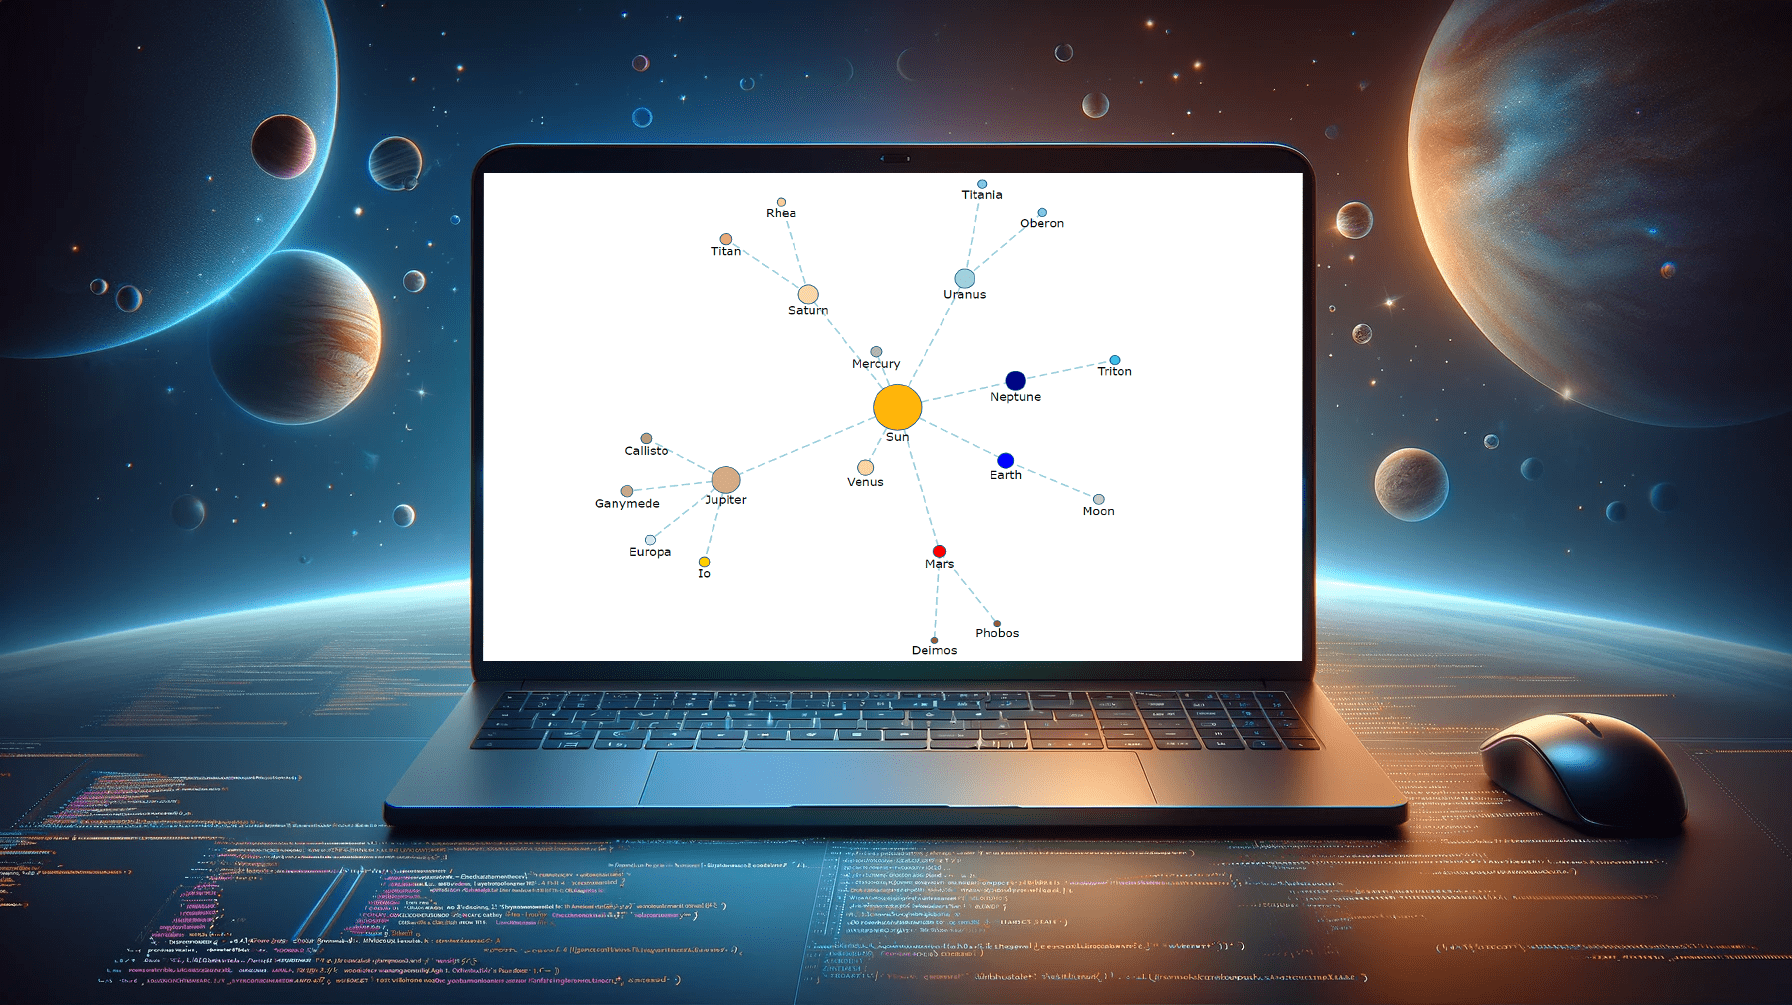
Before we dive into the steps, here’s a sneak peek at the network graph that will be constructed by the end of this tutorial.
Charting Course: Four-Step Odyssey
Creating a network graph this way involves weaving together HTML, JavaScript, and data into a cohesive visual narrative. Here’s our roadmap:
- HTML scaffold: Crafting the digital canvas.
- Instrumental magic: Invoking the sorcery of libraries.
- Data alchemy: Transforming raw data into network graph data.
- JavaScript choreography: Directing the dance of elements.
Step 1: Laying Foundation with HTML
First, we set the stage for our cosmic ballet. We start with a blank HTML page, establishing an HTML block-level element that will host the entire universe of our Solar System network graph. Here’s how we lay the groundwork:
<html>
  <head>
    <title>Network Graph in JavaScript>/title>
    <style type="text/css">
      html, body, #container {
        width: 100%; height: 100%; margin: 0; padding: 0;
      }
    </style>
  </head>
  <body>
    <div id="container"></div>
  </body>
</html>
As you see, we’re introducing a <div> element as a container for our future network graph. By setting its width and height to 100%, we ensure the visualization expansively fills the browser window, inviting viewers to immerse themselves in the data.
Step 2: Including JavaScript Libraries
Before we can summon our graph into existence, we need the right spells — or, in our case, JavaScript libraries. For example, here’s how you can weave AnyChart JS Charts into our HTML tapestry, positioning the scripts within the <head> section:
<html>
  <head>
    <title>Network Graph in JavaScript>/title>
    <style type="text/css">
      html, body, #container {
        width: 100%; height: 100%; margin: 0; padding: 0;
      }
    </style>
    <script src="https://cdn.anychart.com/releases/8.12.1/js/anychart-core.min.js"></script>
    <script src="https://cdn.anychart.com/releases/8.12.1/js/anychart-graph.min.js"></script>
  </head>
  <body>
    <div id="container"></div>
  </body>
</html>
This setup not only loads the essential scripts but also prepares the <body> section for our upcoming dynamic JavaScript code, which will vividly render the network graph.
Step 3: Data Preparation
With the stage set and the scripts in place, it’s time to define the actors in our celestial drama: the nodes (planets, moons) and edges (their relationships). We embed the Solar System data directly within the JavaScript, ensuring each body is represented as a node and each relationship as an edge. For simplicity, this example omits some moons, but it lays the groundwork for you to expand and explore further on your own.
var data = {
  "nodes": [
    { "id": "Sun", "value": 1392700 },
    { "id": "Mercury", "value": 4879 },
    ...
  ],
  "edges": [
    { "from": "Sun", "to": "Mercury", "distance": 50.9 },
    { "from": "Sun", "to": "Venus", "distance": 108.2 },
    ...
  ]
};
Each node and edge carries with it the essence of our solar system, mapping the vast distances and relationships that define it.
Step 4: Code Network Graph Visualization in JavaScript
Finally, the magic happens. We breathe life into our data, transforming it into a vibrant, interactive network graph.
The first act in our celestial choreography begins with ensuring that the script only executes once the HTML document has fully loaded. This safeguard prevents any premature interactions with the DOM, ensuring our script performs flawlessly in the browser’s universe.
anychart.onDocumentReady(function () {
  // Our JS network graph's creation will be configured here.
});
Within the sanctum of our initialization function, we illuminate the celestial bodies of our solar system. This line of JavaScript takes the structured data of planets and their moons and begins the process of turning these into visual elements on our graph.
var chart = anychart.graph(data);Next, with our celestial data vividly characterized and styled, we command the graph to materialize in the designated container on our web page.
chart.container("container");Finally, our last command enlivens our network graph, offering a visual exploration of the solar system that invites curiosity and discovery, much like a map of the stars guiding a traveler through the night sky.
chart.draw();This spellbinding incantation channels our data through the JavaScript charting library, materializing it as a network graph that invites exploration and discovery.
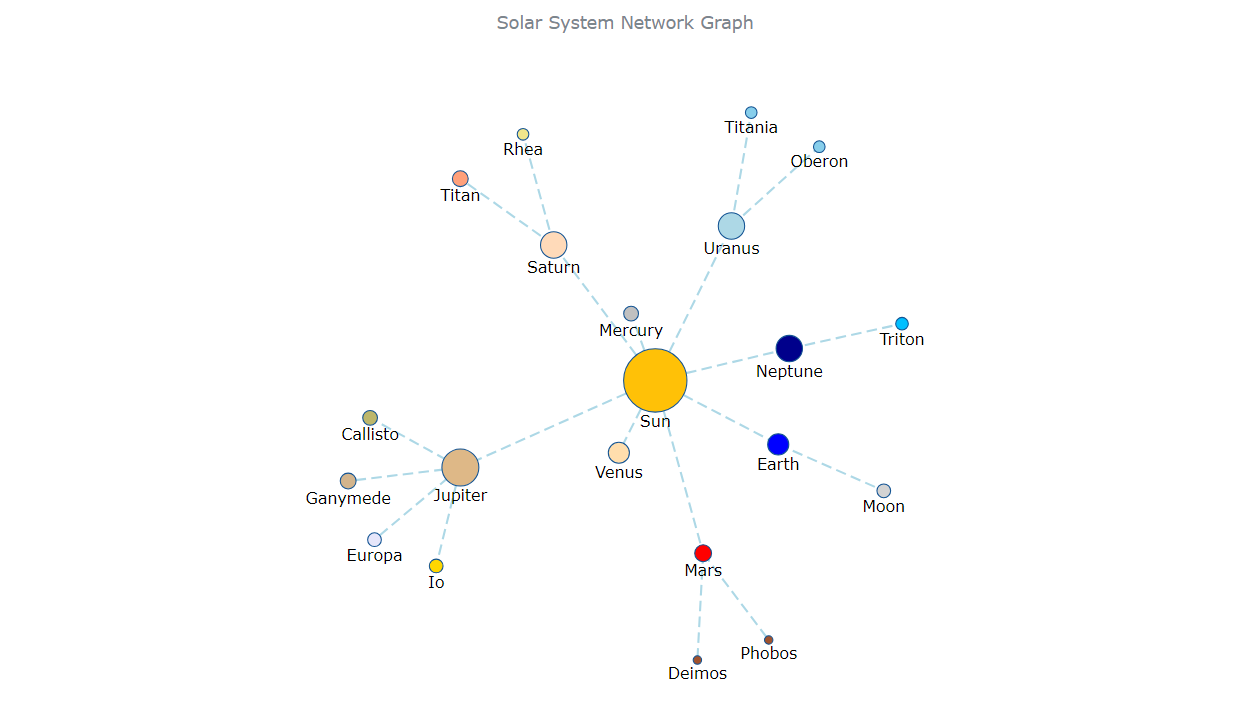
Result: Celestial Dance Visualized
With these steps complete, our network graph is now a digital cosmos, ready to be explored. While we’ve laid the foundation, the universe of customization and exploration is as boundless as space itself, and we’ll dive into that in the next section of the tutorial. The full HTML/CSS/JavaScript code of this basic chart, provided below, serves as both your map and your spacecraft, ready to take you to the next frontier of data visualization.
<html>
  <body>
  <head>
    <title>Network Graph in JavaScript</title>
    <style type="text/css">
      html, body, #container {
        width: 100%; height: 100%; margin: 0; padding: 0;
      }
    </style>
    <script src="https://cdn.anychart.com/releases/8.12.1/js/anychart-core.min.js"></script>
    <script src="https://cdn.anychart.com/releases/8.12.1/js/anychart-graph.min.js"></script>
  <head>
  <body>
    <div id="container"></div>
    <script>
      anychart.onDocumentReady(function () {
        // create data:
        var data = {
          // celestial bodies
          // with their diameter in kilometers:
          "nodes": [
            { "id": "Sun", "value": 1392700 },
            { "id": "Mercury", "value": 4879 },
            { "id": "Venus", "value": 12104 },
            { "id": "Earth", "value": 12756 },
            { "id": "Moon", "value": 3474 },
            { "id": "Mars", "value": 6779 },
            { "id": "Phobos", "value": 22 },
            { "id": "Deimos", "value": 12 },
            { "id": "Jupiter", "value": 142984 },
            { "id": "Io", "value": 3643 },
            { "id": "Europa", "value": 3122 },
            { "id": "Ganymede", "value": 5262 },
            { "id": "Callisto", "value": 4821 },
            { "id": "Saturn", "value": 116464 },
            { "id": "Titan", "value": 5150 },
            { "id": "Rhea", "value": 1527 },
            { "id": "Uranus", "value": 50724 },
            { "id": "Titania", "value": 1578 },
            { "id": "Oberon", "value": 1523 },
            { "id": "Neptune", "value": 49244 },
            { "id": "Triton", "value": 2706 }
          ],
          // connections between celestial bodies
          // with the distance between them in million kilometers:
          "edges": [
            { "from": "Sun", "to": "Mercury", "distance": 50.9 },
            { "from": "Sun", "to": "Venus", "distance": 108.2},
            { "from": "Sun", "to": "Earth", "distance": 148.7 },
            { "from": "Earth", "to": "Moon", "distance": 0.3877 },
            { "from": "Sun", "to": "Mars", "distance": 207.6 },
            { "from": "Mars", "to": "Phobos", "distance": 0.00567 },
            { "from": "Mars", "to": "Deimos", "distance": 0.02006},
            { "from": "Sun", "to": "Jupiter", "distance": 748.5 },
            { "from": "Jupiter", "to": "Io", "distance": 0.3484 },
            { "from": "Jupiter", "to": "Europa", "distance": 0.6025 },
            { "from": "Jupiter", "to": "Ganymede", "distance": 0.9961 },
            { "from": "Jupiter", "to": "Callisto", "distance": 1.81 },
            { "from": "Sun", "to": "Saturn", "distance": 1450 },
            { "from": "Saturn", "to": "Titan", "distance": 1.17 },
            { "from": "Saturn", "to": "Rhea", "distance": 0.4667 },
            { "from": "Sun", "to": "Uranus", "distance": 2930 },
            { "from": "Uranus", "to": "Titania", "distance": 0.4095 },
            { "from": "Uranus", "to": "Oberon", "distance": 0.5559 },
            { "from": "Sun", "to": "Neptune", "distance": 4470 },
            { "from": "Neptune", "to": "Triton", "distance": 0.3287 }
          ]
        };
        // create a network graph and set the data:
        var chart = anychart.graph(data);
        // set the chart title:
        chart.title("Solar System Network Graph");
        // set the container id:
        chart.container("container");
        // initiate drawing the chart:
        chart.draw();
      });
    </script>
  </body>
<html>
Customizing JavaScript Network Graph
As our voyage through the digital cosmos deepens, let’s refine our network graph with some astute customizations, ensuring each celestial body and connection is not only seen but understood in vivid detail. These enhancements will infuse our graph with both beauty and functionality, turning it into a dynamic map of the solar system that invites further exploration.
Enhancing Nodes
With our solar system taking shape, let’s ensure that each celestial body is clearly identifiable. We achieve this by customizing their appearance, adding labels, and enhancing tooltips. This will allow stargazers to not only see the planets and moons but to also gauge their relative sizes and other key attributes at a glance.
First, let’s infuse our JavaScript universe with a bit of cosmic artistry. The fill attribute in our data effectively showcases each planet and moon with distinct colors, subtly reflecting their unique characteristics and atmospheres. Considering the circular nature of our nodes, the height attribute alone suffices to represent the size of each celestial body, allowing us to differentiate their scales visually. This simple yet powerful combination of color and size crafts an elegant map of our solar system.
var data = {
  "nodes": [
    { "id": "Sun", "value": 1392700, "fill": "#FFC107", "height": 60 },
    { "id": "Mercury", "value": 4879, "fill": "#C0C0C0", "height": 14 },
    { "id": "Venus", "value": 12104, "fill": "#FFDEAD", "height": 20 },
    // Additional nodes follow
  ],
  // Connections between these celestial bodies are defined elsewhere
};
In this case, the height values for each celestial body are approximations, chosen to visually indicate relative sizes while maintaining clarity. These values are not to scale but are designed to ensure that all elements, from the massive Sun to the smaller moons, are visible and distinct within our network graph. This simplification helps keep the visualization clear and accessible, avoiding the complexities of true astronomical scales.
Second, we enable labels for each node, making sure every celestial body in our solar system is immediately recognizable:
var nodes = chart.nodes();
nodes.labels().enabled(true);
Next, we set the visual style of these labels to ensure they are clear and aesthetically pleasing:
nodes.labels().fontSize(15);
nodes.labels().fontColor("black");
Finally, we add tooltips that show detailed information about each celestial body when hovered over. This feature uses HTML to enhance the presentation, showing both the name and diameter of the celestial bodies:
nodes.tooltip().useHtml(true);
nodes.tooltip().format(function(e){
  const name = e.getData("id");
  const value = e.getData("value");
  return `<b>${name}<br>${diameter}</b> km in diameter`
});
This code dynamically assigns labels and configures tooltips to display the name and diameter of each celestial body, enriching the user’s interaction with the graph by providing immediate, contextual information.
Edge Customization
As we map the connections within our Solar System network, the second step focuses on the edges — those invisible forces that connect our celestial bodies. By enhancing the edges with detailed tooltips and a visually distinct style, we provide viewers with insights into the distances between these bodies, rendering the vastness of space comprehensible.
First, we enhance the tooltips on the edges to display detailed distance information between celestial bodies:
var edges = chart.edges();
edges.tooltip().useHtml(true);
edges.tooltip().format(function(e){
  const from = e.getData("from");
  const to = e.getData("to");
  const distance = e.getData("distance") * 1000000;  // Converting million km to km
  return `From <b>${from} to ${to}</b><br><b>${distance}</b> km`
});
Then, we customize the appearance of these edges to make them visually distinctive, applying a light blue stroke with a specific pattern:
edges.stroke("lightblue", 2, "10 5");This customization not only visually differentiates the types of connections but also offers detailed information about the distances, enhancing understanding through interactive learning.
Setting Graph Title
To encapsulate our stellar journey, we crown our graph with a fitting title, summarizing our narrative in a single line:
chart.title("Solar System Network Graph");This title not only adds a professional touch to our visualization but also frames the network graph as a comprehensive schematic of solar system connections, inviting viewers to delve into a graphical exploration of celestial relationships.
Final Solar System Network Graph
Our network graph is now ready, capturing the intricate dance of the celestial bodies within our solar system. Below is the complete HTML/CSS/JavaScript code snippet for our project. Use this as a foundational blueprint for your exploration into network graph visualization, or as a launchpad for creating more complex and detailed visual data representations.
<html>
  <body>
  <head>
    <title>Network Graph in JavaScript</title>
    <style type="text/css">
      html, body, #container {
        width: 100%; height: 100%; margin: 0; padding: 0;
      }
    </style>
    <script src="https://cdn.anychart.com/releases/8.12.1/js/anychart-core.min.js"></script>
    <script src="https://cdn.anychart.com/releases/8.12.1/js/anychart-graph.min.js"></script>
  <head>
  <body>
    <div id="container"></div>
    <script>
      anychart.onDocumentReady(function () {
        // create data:
        var data = {
          // celestial bodies
          // with their diameter in kilometers:
          "nodes": [
            { "id": "Sun", "value": 1392700, "fill": "#FFC107", "height": 60 },
            { "id": "Mercury", "value": 4879, "fill": "#C0C0C0", "height": 30 },
            { "id": "Venus", "value": 12104, "fill": "#FFDEAD", "height": 30 },
            { "id": "Earth", "value": 12756, "fill": "#0000FF", "height": 30 },
            { "id": "Moon", "value": 3474, "fill": "#D3D3D3", "height": 15 },
            { "id": "Mars", "value": 6779, "fill": "#FF0000", "height": 30 },
            { "id": "Phobos", "value": 22, "fill": "#A0522D", "height": 15 },
            { "id": "Deimos", "value": 12, "fill": "#A0522D", "height": 15 },
            { "id": "Jupiter", "value": 142984, "fill": "#DEB887", "height": 30 },
            { "id": "Io", "value": 3643, "fill": "#FFD700", "height": 15 },
            { "id": "Europa", "value": 3122, "fill": "#E6E6FA", "height": 15 },
            { "id": "Ganymede", "value": 5262, "fill": "#D2B48C", "height": 15 },
            { "id": "Callisto", "value": 4821, "fill": "#BDB76B", "height": 15 },
            { "id": "Saturn", "value": 116464, "fill": "#FFDAB9", "height": 30 },
            { "id": "Titan", "value": 5150, "fill": "#FFA07A", "height": 15 },
            { "id": "Rhea", "value": 1527, "fill": "#F0E68C", "height": 15 },
            { "id": "Uranus", "value": 50724, "fill": "#ADD8E6", "height": 30 },
            { "id": "Titania", "value": 1578, "fill": "#87CEEB", "height": 15 },
            { "id": "Oberon", "value": 1523, "fill": "#87CEEB", "height": 15 },
            { "id": "Neptune", "value": 49244, "fill": "#00008B", "height": 30 },
            { "id": "Triton", "value": 2706, "fill": "#00BFFF", "height": 15 }
          ],
          // connections between celestial bodies
          // with the distance between them in million kilometers:
          "edges": [
            { "from": "Sun", "to": "Mercury", "distance": 50.9 },
            { "from": "Sun", "to": "Venus", "distance": 108.2},
            { "from": "Sun", "to": "Earth","distance": 148.7 },
            { "from": "Earth", "to": "Moon","distance": 0.3877 },
            { "from": "Sun", "to": "Mars", "distance": 207.6 },
            { "from": "Mars", "to": "Phobos", "distance": 0.00567 },
            { "from": "Mars", "to": "Deimos", "distance": 0.02006},
            { "from": "Sun", "to": "Jupiter", "distance": 748.5 },
            { "from": "Jupiter", "to": "Io", "distance": 0.3484 },
            { "from": "Jupiter", "to": "Europa", "distance": 0.6025 },
            { "from": "Jupiter", "to": "Ganymede",  "distance": 0.9961 },
            { "from": "Jupiter", "to": "Callisto", "distance": 1.81 },
            { "from": "Sun", "to": "Saturn", "distance": 1450 },
            { "from": "Saturn", "to": "Titan", "distance": 1.17 },
            { "from": "Saturn", "to": "Rhea", "distance": 0.4667 },
            { "from": "Sun", "to": "Uranus", "distance": 2930 },
            { "from": "Uranus", "to": "Titania", "distance": 0.4095 },
            { "from": "Uranus", "to": "Oberon", "distance": 0.5559 },
            { "from": "Sun", "to": "Neptune", "distance": 4470 },
            { "from": "Neptune", "to": "Triton", "distance": 0.3287 }
          ]
        };
        // create a network graph and set the data:
        var chart = anychart.graph(data);
        // enable node labels:
        var nodes = chart.nodes();
        nodes.labels().enabled(true);
        // customize node labels:
        nodes.labels().fontSize(15);
        nodes.labels().fontColor("black")
        // customize node tooltips:
        nodes.tooltip().useHtml(true);
        nodes.tooltip().format(function(e){
          const name = e.getData("id");
          const value = e.getData("value");
          return `<b>${name}<br>${value}</b> km in diameter`
        });
        // customize edge tooltips:
        var edges = chart.edges();
        edges.tooltip().useHtml(true);
        edges.tooltip().format(function(e){
          const from = e.getData("from");
          const to = e.getData("to");
   	  const distance = e.getData("distance") * 1000000;
   	  return `From <b>${from}</b> to <b>${to}<br>${distance}</b> km`
        })
        // customize the edge stroke:
        edges.stroke("lightblue", 2, "10 5")
        // set the chart title:
        chart.title("Solar System Network Graph");
        // set the container id:
        chart.container("container");
        // initiate drawing the chart:
        chart.draw();
      });
    </script>
  </body>
<html>
Navigating Space: Conclusion and Further Voyages
Congratulations, stargazer! You’ve not only journeyed through the process of crafting a basic JavaScript network graph but have also ventured beyond, customizing it to unveil the rich tapestry of the Solar System. Armed with these skills, the universe of data visualization is yours to explore.
May this tutorial serve as your launchpad. The skills you’ve honed open a galaxy of possibilities. Venture forth, explore the vast expanse of the network graph documentation, and draw inspiration from more network graph examples. Your next discovery is just beyond the horizon. Happy network graphing!
We’re thankful to Taylor Brooks for producing this amazing Network Graph tutorial as a guest post for our blog.
Feel free to dive deeper into the creation of network graphs using JavaScript (HTML5) with another Network Graph Tutorial on our blog, where Wayde Herman delves into visualizing the battles of “Game of Thrones.”
Check out more JavaScript charting tutorials.
Got a guest post idea? Let’s make it work!
- Categories: AnyChart Charting Component, HTML5, JavaScript, JavaScript Chart Tutorials, Tips and Tricks
- No Comments »