 This week’s DataViz Weekly showcases a quartet of compelling data-driven stories, each powered by the adept use of data visualization techniques. These narratives not only inform but inspire, perhaps sparking creative concepts for your upcoming projects.
Here are the visual stories featured in this issue:
- Unraveling the hold of historical mortgage rates in the U.S. — The Upshot
- Retelling the transformation of San Francisco’s Japantown after Roosevelt’s Executive Order 9066 — The San Francisco Chronicle
- Revealing hidden risks in common fragrances — Bloomberg
- Exploring the persistent shadows of teen adversity — The Pudding
Data Visualization Weekly: April 12, 2024 — April 19, 2024
Unraveling Hold of Historical Mortgage Rates in U.S.
 For those feeling trapped by historically favorable mortgage rates, this story resonates deeply. The Upshot delivers a compelling visual narrative on how current U.S. homeowners are financially disincentivized to move due to the stark contrast between their locked-in rates and the escalating new loan costs.
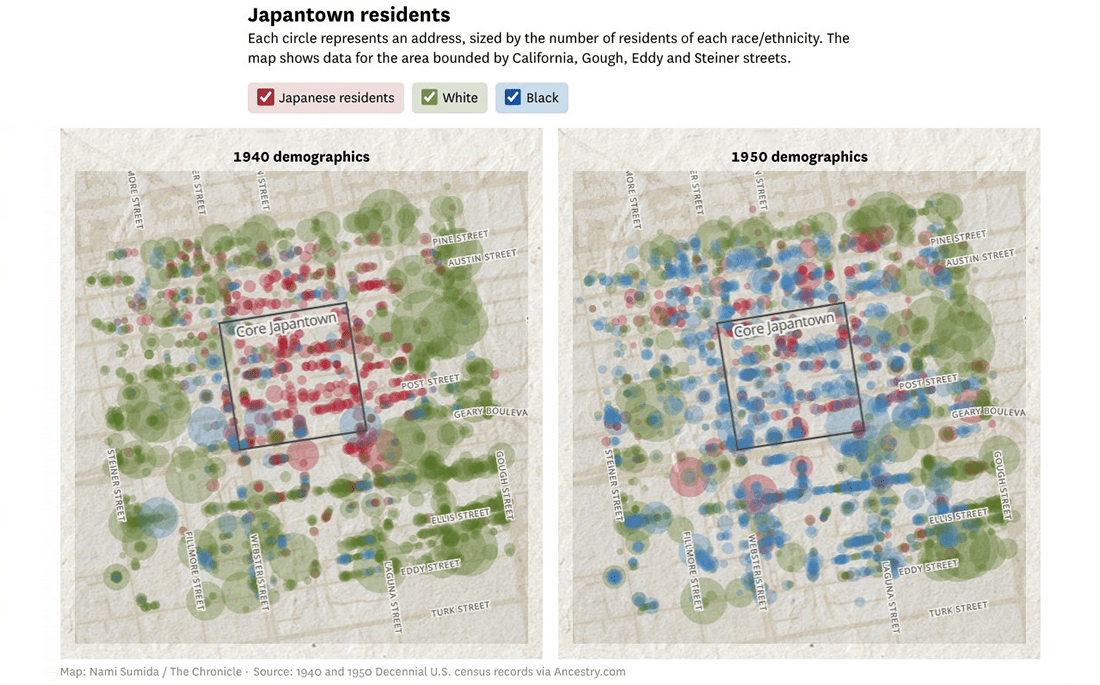
Building on new research by economists at the Federal Housing Finance Agency, Emily Badger and Francesca Paris use a series of charts to clarify trends. Notably, a stacked area chart illustrates how the proportion of existing mortgages with rates below or above the new market rate has evolved over two decades, with recent years highlighting a particularly static situation.
Explore this visual story and understand the current housing quandary, on The Upshot.
Retelling the Transformation of San Francisco’s Japantown After Roosevelt’s Executive Order 9066
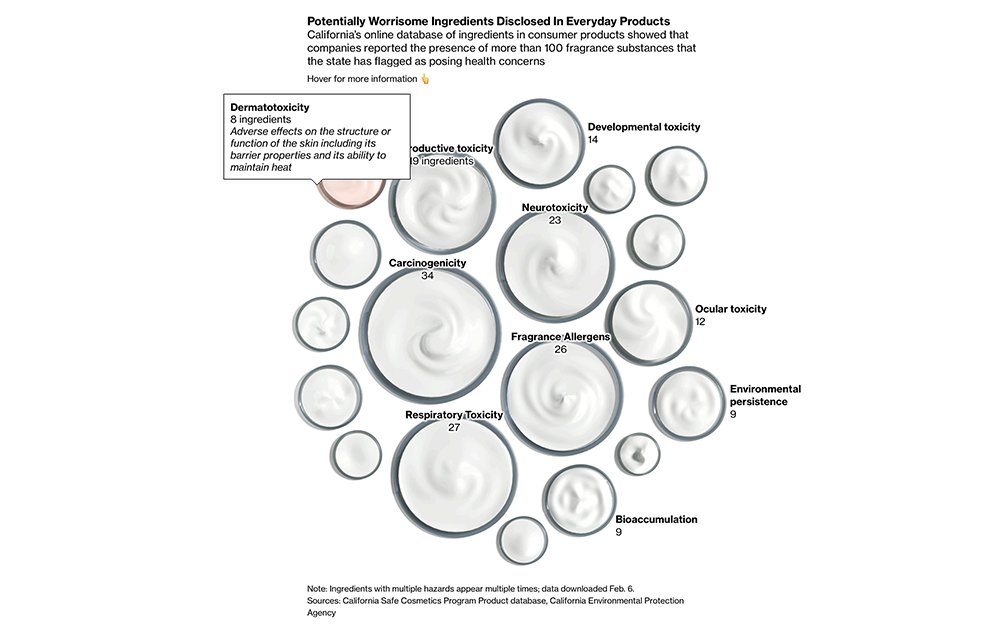
The early 1940s marked the prime of San Francisco’s Japantown, which was dramatically altered on February 19, 1942, two months after the Pearl Harbor attack, when President Franklin Delano Roosevelt mandated that those of Japanese descent be relocated to internment camps.
In a poignant historical recap, the San Francisco Chronicle leverages newly released census data to trace the devastating impact of wartime incarceration on Japantown’s demographic makeup. Utilizing detailed maps, this narrative vividly depicts the shifts from 1940 to 1950, intertwining the resilience and tribulations of a community forever changed by Executive Order 9066.
Check out this detailed historical piece and track the transformation of Japantown, on The San Francisco Chronicle.
Revealing Hidden Risks in Common Fragrances
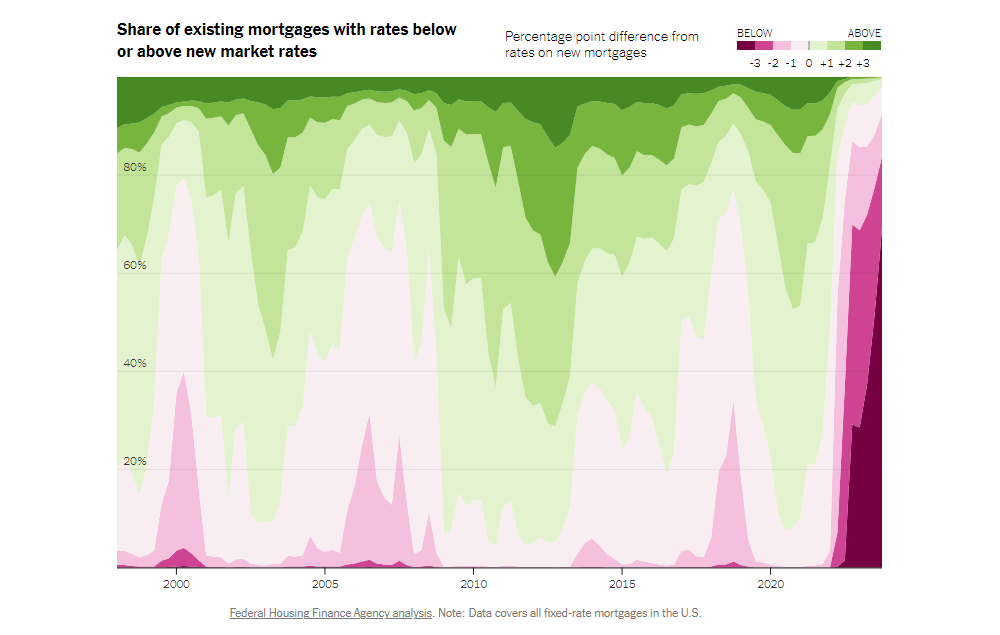
While scented products are pleasing to the nose, they may be harmful to our well-being. Bloomberg’s Daniela Sirtori, Madeline Campbell, and Marie Patino dive deep into the California Department of Public Health’s database to expose the potential dangers hidden in the fragrances we use daily.
Their analysis identifies 108 potentially harmful substances listed as fragrance ingredients in everyday products, from face wash to conditioner. Scaled jars of cream effectively categorize these ingredients, highlighting the need for greater transparency and urging consumers to scrutinize the contents of the products they use daily.
See the article and discover the hidden dangers of scented products, on Bloomberg.
Exploring the Persistent Shadows of Teen Adversity
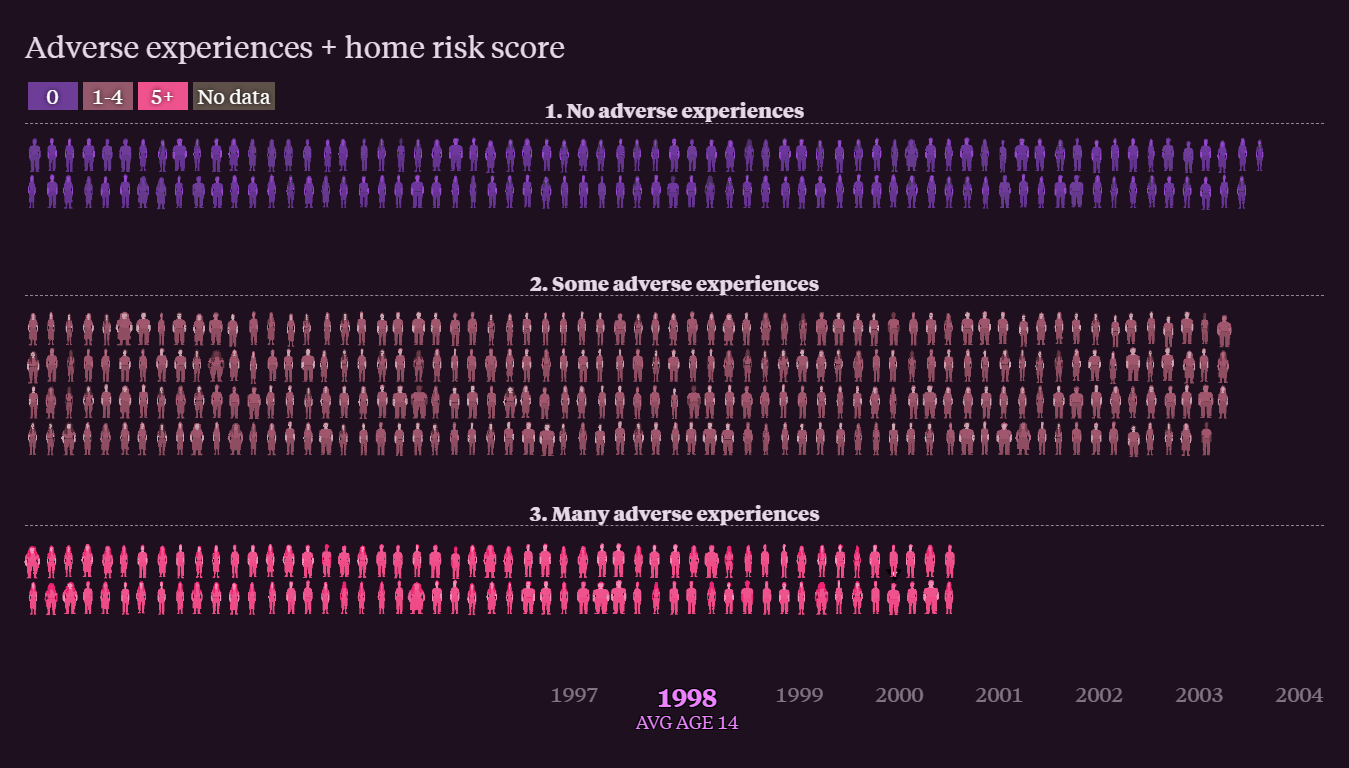
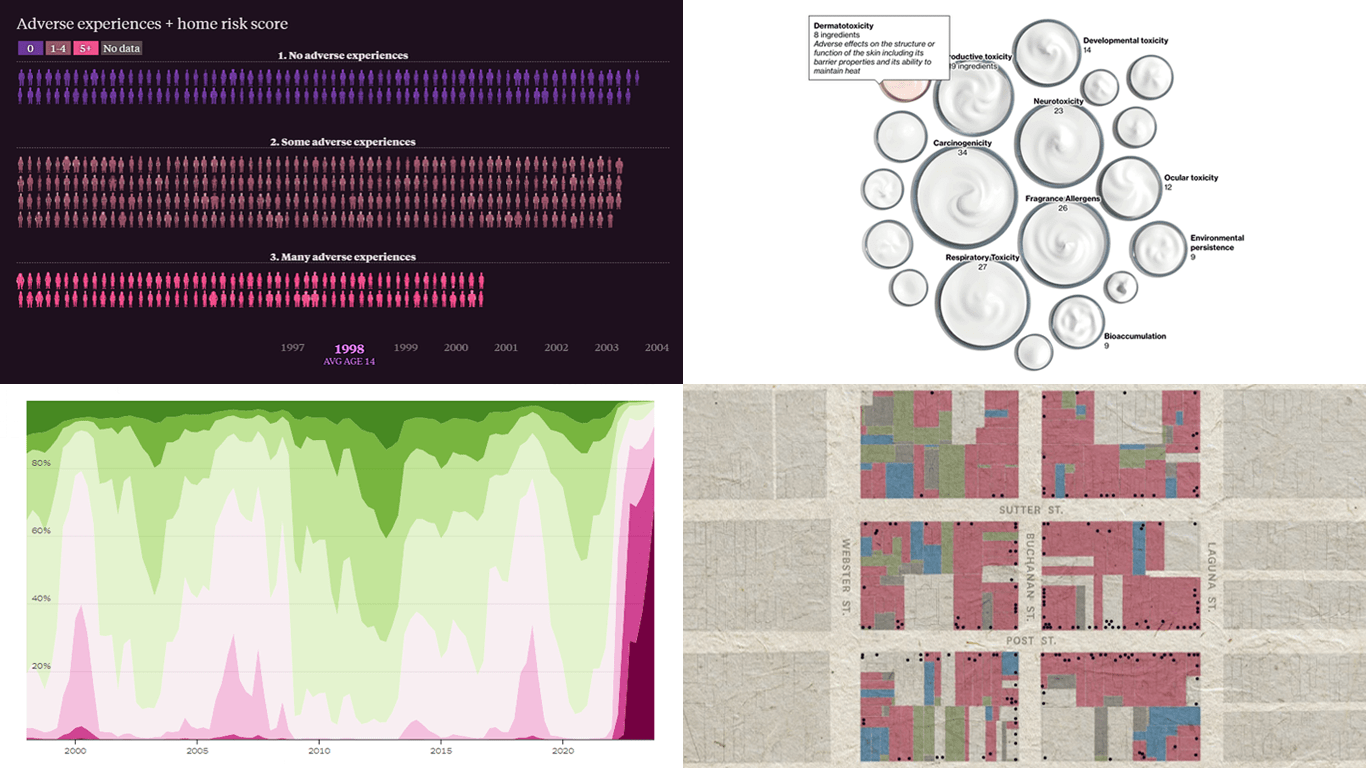
Adverse childhood experiences can cast long shadows over our lives, affecting health, relationships, happiness, and financial security. Alvin Chang uses data from the National Longitudinal Surveys to illustrate the enduring impact of teenage adversity on adult life. Chang translates the data into a relatable narrative, with each icon representing a survey respondent, mapping their journey through various life stages.
Dive into this story and view the long-term effects of teenage adversity, on The Pudding.
Wrapping Up
This week’s DataViz Weekly brought to light four amazing stories, demonstrating the significant role data visualization plays in understanding complex issues. We invite you to explore these projects further.
If you’ve created or come across a compelling data visualization, please share it with us and we may well feature in the next issue.
Join us again next Friday for another set of impressive data visualization examples. Dive in, share, and stay tuned!
- Categories: Data Visualization Weekly
- No Comments »